Distributed System Debugging Techniques
Issue #132: System Design Interview Roadmap • Section 5: Reliability & Resilience
When Your Distributed System Becomes a Crime Scene
Your payment service just failed, but here's the puzzle: every individual component reports healthy status. Users can't complete purchases, yet your monitoring dashboards glow green. Sound familiar? This is the distributed systems debugging paradox—the whole system fails while its parts appear functional.
Unlike debugging a single process where you can set breakpoints and inspect memory, distributed systems spread their secrets across dozens of services, multiple data centers, and thousands of log entries. The bug isn't in one place—it emerges from the complex interactions between supposedly healthy components.
What You'll Master Today
Correlation-First Debugging: How to trace failures across service boundaries without getting lost in log noise
Temporal Debugging Patterns: Why timing matters more than logic in distributed failures
State Reconstruction Techniques: Rebuilding system state from scattered evidence
Advanced Observability Strategies: Moving beyond basic metrics to system behavior analysis
The Hidden Art of Distributed Debugging
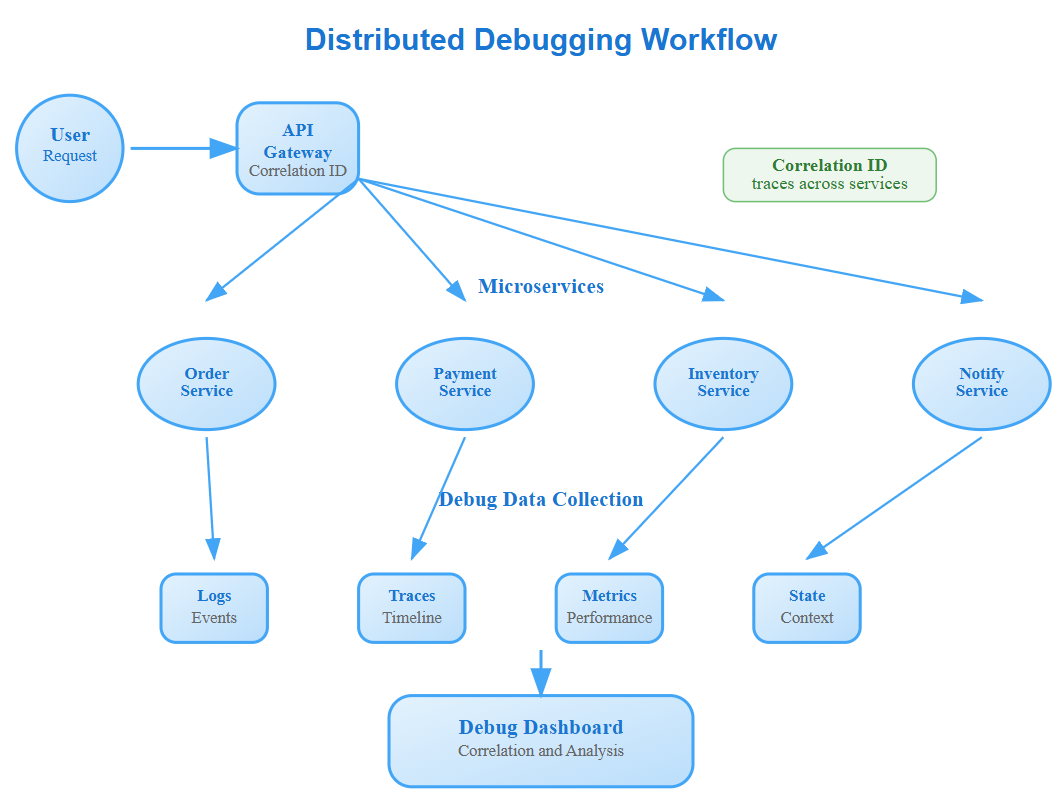
Correlation IDs: Your Digital Breadcrumbs
The most underestimated debugging tool is the correlation ID. Unlike traditional debugging where you follow a single thread, distributed systems require following a request's journey across multiple services. But here's the insight most engineers miss: correlation isn't just about request tracing—it's about state correlation.
Netflix discovered that 70% of their debugging time was spent correlating logs across services. Their solution? Multi-dimensional correlation IDs that encode not just the request path, but also the user context, feature flags, and deployment version. This allows debugging team to reconstruct not just what happened, but why the system made specific decisions.