
Garbage Collection Tuning: How Java and Go GC Shape Your Latency Profile
Section 8: Production Engineering & Optimization | Article 202
Opening Hook
Your service is running fine — p50 at 12ms, p95 at 45ms — until once every few seconds the JVM decides it needs to clean up memory. Everything freezes. P99 spikes to 800ms. Clients timeout. Alerts fire. Your on-call engineers spend 3 hours chasing what looks like a network issue before someone checks GC logs and finds 400ms stop-the-world pauses happening every 8 seconds. This is the hidden tax of garbage-collected runtimes. The GC wasn’t broken. It was doing exactly what it was designed to do — and that’s the problem.
Core Concept Explanation
Garbage collection is automatic memory reclamation: the runtime identifies objects no longer reachable by the program and frees that memory. The catch is that “identifying unreachable objects” requires either pausing application threads (stop-the-world, or STW) or running concurrently while carefully coordinating with them.
The two runtimes behave fundamentally differently.
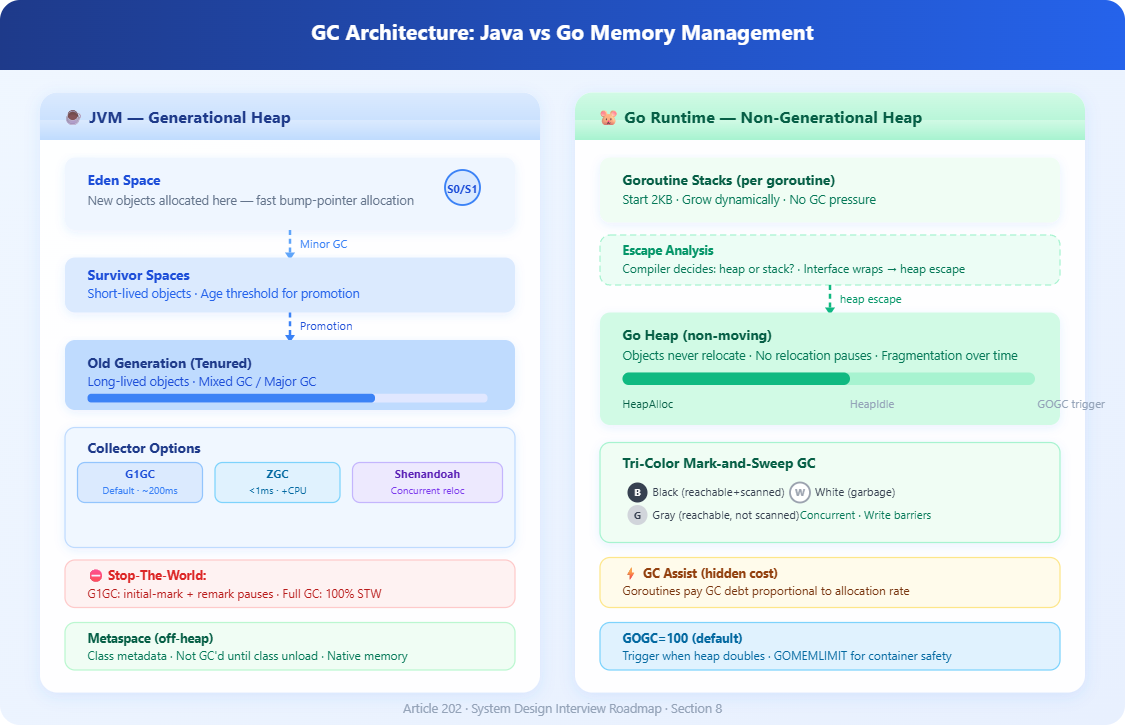
Java’s GC evolution spans decades. The original serial and parallel collectors stopped all threads for every collection. G1GC (the default since Java 9) splits the heap into equal-sized regions (1–32MB), collects the highest-garbage regions first, and runs most work concurrently — but still has STW phases for initial mark and remark. Under high allocation pressure, G1 can trigger “full GC” which is fully STW and can pause for seconds on multi-gigabyte heaps.
ZGC and Shenandoah are Java’s modern low-latency collectors. Both target sub-millisecond pauses regardless of heap size by doing almost all work concurrently, including the relocation phase. They achieve this through load barriers (ZGC) and read/write barriers (Shenandoah) that intercept every pointer access to handle objects being moved while the application runs. The tradeoff: 5–15% higher CPU overhead and slightly lower throughput compared to G1.
Go’s GC is a concurrent tri-color mark-and-sweep collector. It doesn’t compact the heap (objects don’t move), which eliminates relocation pauses entirely but causes heap fragmentation over time. Go’s GC runs when the heap doubles since the last collection (controlled by GOGC, default 100). Pauses in Go are typically short — under 1ms for most workloads — but Go instead has a different problem: GC assist. When allocation is outpacing the background GC, Go forces allocating goroutines to do GC work themselves, directly adding latency to those goroutines proportional to their allocation rate.
The allocation rate is the root cause behind most GC latency problems. Higher allocation pressure → more frequent collections → more CPU stolen from your application → higher latency. This holds true for both Java and Go, though the symptoms manifest differently.
In Java, excess allocation leads to promoted objects filling the old generation faster, triggering expensive mixed or full GC cycles. In Go, it causes GC assist triggering mid-request, adding unpredictable microseconds to goroutines that happen to allocate during a GC cycle.
Heap sizing and GC frequency trade-off. A larger heap means GC runs less frequently (good for throughput) but individual collections scan more live objects and reclaim more garbage at once (worse for pause duration with STW collectors). With concurrent collectors like ZGC and Go’s GC, larger heaps mostly affect background GC CPU usage rather than pause times — but the heap must fit in physical memory or you’ll page fault into GC pauses measured in seconds.
Critical Insights
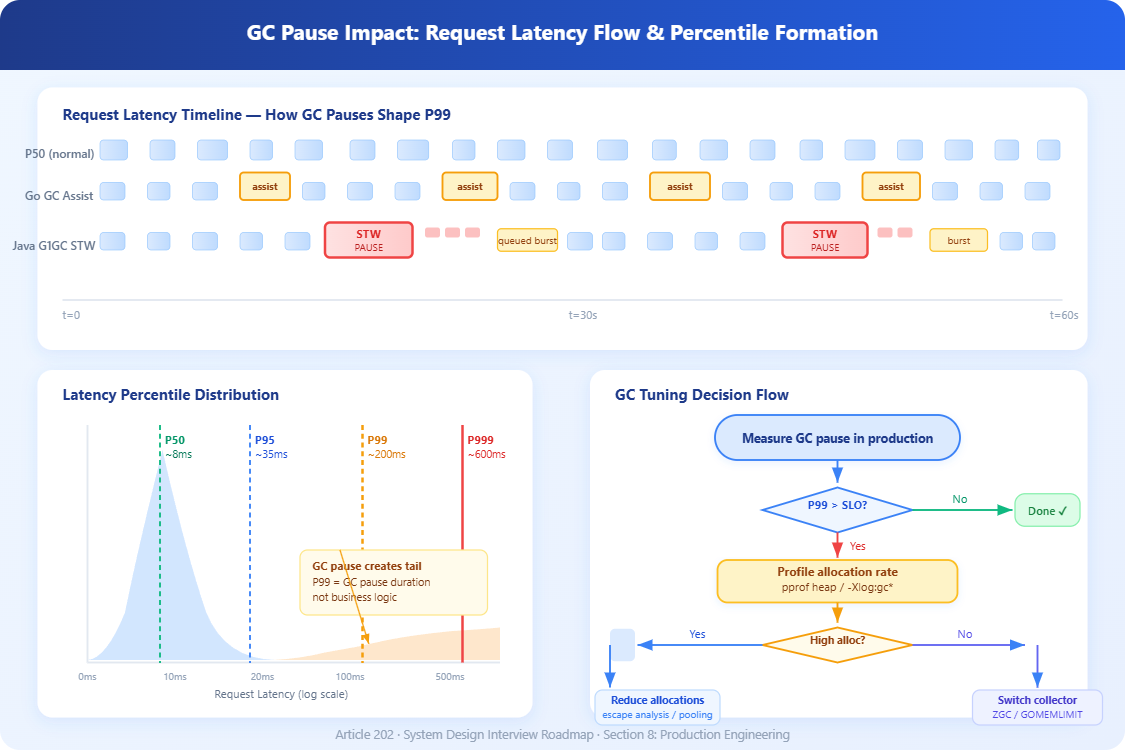
1. P99 latency is dominated by GC pauses, not business logic. Most teams optimize their database queries and cache hit rates while ignoring that their P99 is entirely determined by GC pause frequency. A 50ms pause every 10 seconds produces a P99 of ~50ms regardless of how fast your actual request processing is.
2. Go’s escape analysis is your GC budget. When Go’s compiler cannot prove an object’s lifetime stays within a function, it allocates on the heap instead of the stack. Interface conversions, closures capturing pointers, and fmt.Sprintf all commonly cause heap escapes. Running go build -gcflags='-m' reveals escape decisions. Reducing heap allocations in hot paths directly reduces GC pressure and GC assist latency — often more impactful than tuning GOGC.
3. GOMEMLIMIT changes everything for Go in containers. Before Go 1.19, Go’s GC had no awareness of container memory limits. The runtime would grow the heap until OOM kill, or GC so aggressively it couldn’t keep up. GOMEMLIMIT sets a soft total memory limit, allowing Go’s GC to trigger more aggressively before hitting the hard limit. Set it to ~85–90% of your container’s memory limit to prevent OOM kills while avoiding excessive GC thrashing.
4. Java’s GC ergonomics can work against you at low heap sizes. G1GC defaults target 250ms max pause time. On small heaps (under 2GB), the ergonomics-driven region sizing often makes G1 behave worse than Parallel GC. If your service uses under 1GB heap, benchmark SerialGC or ParallelGC — they may give better throughput with acceptable pauses.
5. Survivor space promotion storms. In Java, short-lived objects that survive into the old generation (”premature promotion”) because survivor spaces are too small can cause major GC frequency to spike by 10x. This happens when request-scoped caches, connection objects, or thread-local buffers outlive a minor GC cycle. Monitoring with -Xlog:gc* and looking for rapid old-gen growth identifies this pattern.
6. GC tuning interacts with NUMA topology. On multi-socket servers, Java’s G1GC and ZGC are not NUMA-aware by default on Linux. GC threads allocating region metadata on a remote NUMA node adds 30–80ns per access. For latency-critical services on multi-socket hardware, -XX:+UseNUMA can reduce GC metadata access latency, though it requires careful heap sizing per node.
Real-World Examples
Discord’s 2020 migration from Java to Go for their read states service wasn’t primarily about throughput — it was about GC pauses. Their Java service experienced 2–5 minute latency spikes every 2 minutes as G1GC ran major collections on a heap storing millions of user state objects. After migrating to Go, they initially saw worse performance because Go’s GC was running every 2 minutes too, triggered by their in-memory LRU cache doubling in size. The fix was setting
GOGC=offand manually triggeringruntime.GC()on a schedule, reducing GC frequency from every 2 minutes to every hour. This demonstrates that Go’s GC is not automatically better — the workload’s memory access pattern determines which tuning approach wins.
LinkedIn’s feed ranking service runs on Java with ZGC on heaps of 32–64GB. Before ZGC, their G1GC configuration required careful tuning of
-XX:G1HeapRegionSize,-XX:G1MixedGCLiveThresholdPercent, and survivor space ratios to achieve p99 under 200ms. ZGC eliminated the tuning burden and achieved consistent sub-5ms pauses at the same heap sizes, at the cost of 8% higher CPU utilization across their fleet — an acceptable trade-off given their latency SLOs.
Cloudflare’s Go-based DNS resolver reduced p99 latency by 40% through escape analysis optimization. Audit of hot paths found that DNS record struct allocations were escaping to the heap due to interface wrapping in their logging layer. Replacing interface{} log fields with concrete typed fields in critical paths kept allocations on the stack, reducing per-request heap allocations from ~4KB to ~300 bytes, dropping GC assist frequency from 15% of requests to under 1%.
Architectural Considerations
GitHub Link
https://github.com/sysdr/sdir/tree/main/Garbage_Collection_tuning/gc-tuning-demoGC tuning doesn’t exist in isolation. GC pause events must appear in your distributed traces — a 40ms GC pause inside a 50ms request is invisible unless you emit a trace span for GC events. Both Java (via JFR + OpenTelemetry JVM metrics) and Go (via runtime/metrics and debug.ReadGCStats) expose GC timing that should feed into your observability stack.
Cost implications are real: switching from G1 to ZGC on a fleet consuming 500 CPU cores adds ~40 cores of GC overhead. Increasing heap size to reduce GC frequency increases memory cost per instance. Right-sizing requires load testing at realistic allocation rates, not just throughput benchmarks. The optimal configuration depends on your latency SLO, your fleet’s memory-to-CPU ratio, and your allocation pattern — no universal answer exists.
Practical Takeaway
Start by measuring before tuning. Enable GC logging in production (both Java and Go expose this with minimal overhead). Identify whether your P99 latency spikes correlate with GC pause events. In Java, run with -Xlog:gc*:file=gc.log:time,uptime:filecount=5,filesize=10m. In Go, set GODEBUG=gctrace=1 on a test instance to observe pause times and GC frequency.
For Java services with latency SLOs under 100ms: migrate to ZGC if on Java 15+. Set
-XX:SoftMaxHeapSizeto 80% of-Xmxto give ZGC headroom before triggering concurrent GC cycles. For Go services: audit escape analysis with-gcflags='-m', setGOMEMLIMITto 85% of container memory, and profile allocation rates withpprofheap profiles.
Run bash setup.sh to launch a working demo that spins up a Java service (ZGC vs G1GC comparison) and a Go service side-by-side, with a real-time dashboard showing GC pause distribution, allocation rates, and their direct impact on request latency percentiles. You’ll configure GC settings live and watch the latency profile change in real time.
Youtube Demo Link:
Article 202 | Section 8: Production Engineering & Optimization System Design Interview Roadmap Newsletter