
Linux Troubleshooting: The Hidden Stories Behind CPU, Memory, and I/O Metrics
Introduction: Monitoring Dashboard is Lying
You’re staring at a dashboard showing 60% CPU utilization, 40% memory free, and disk I/O graphs that look reasonable. Everything seems fine. Then your phone rings—P99 latency has skyrocketed, users are complaining, and your on-call engineer is panicking.
Here’s what nobody tells you: the basic metrics you learned in your systems course are almost useless in production without context. After debugging performance issues in systems handling 10 million requests per second, I’ve learned that what looks healthy can be dying, and what looks terrible might be perfectly optimized.
This guide will teach you to read between the lines of Linux performance metrics, understand what’s really happening inside the kernel, and develop an intuition for troubleshooting that goes far beyond running top and hoping for answers.
Part 1: CPU Troubleshooting - Beyond the Percentages
The Load Average Mystery Everyone Gets Wrong
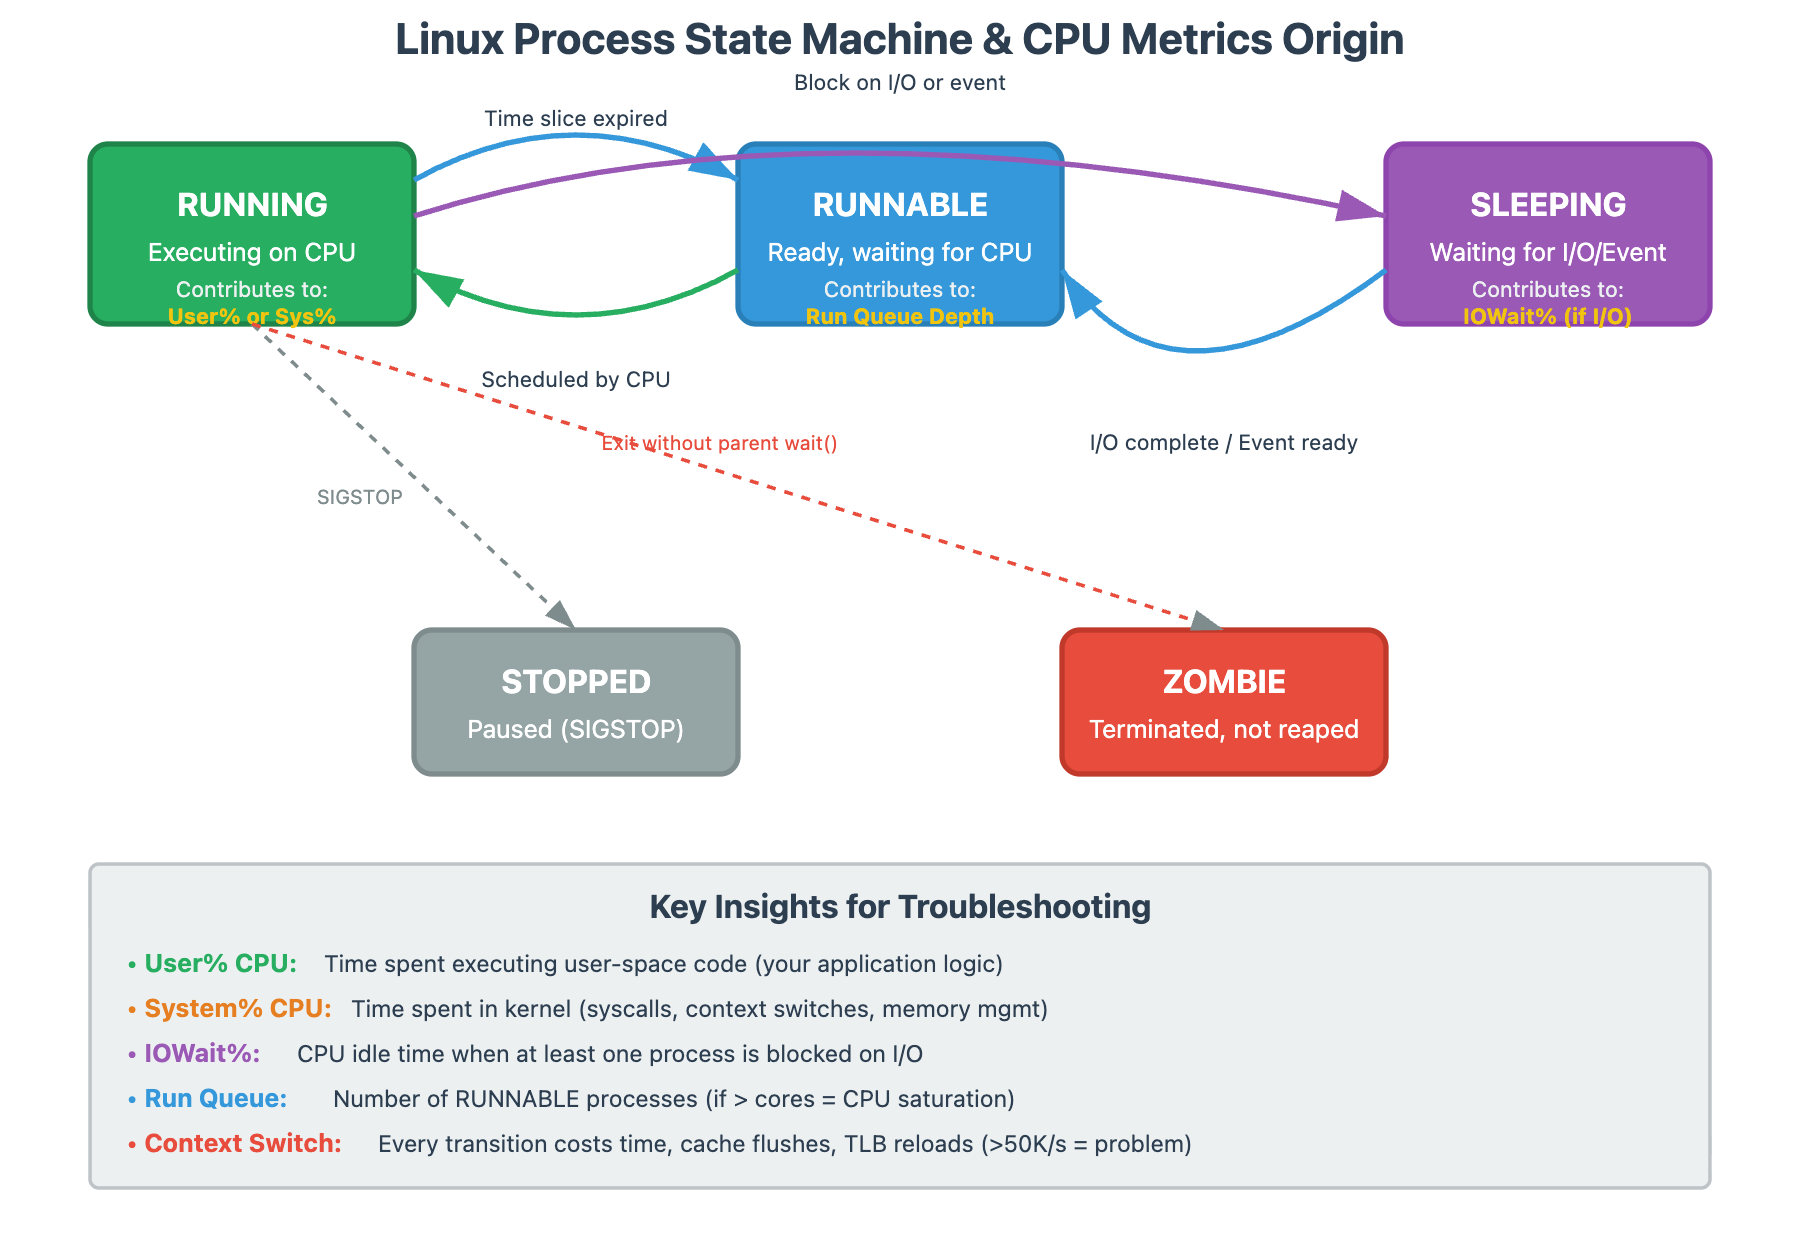
When someone tells me their server has a load average of 8.0 on a 4-core machine, my first question isn’t “that’s bad, right?” It’s “what’s your application doing?”
Load average measures processes waiting for CPU and processes waiting for I/O. A database server with load average of 20 might be perfectly healthy if it’s handling tons of concurrent queries efficiently. A web server with load average of 2 might be completely saturated if every request is CPU-intensive.
The critical insight: compare load average to run queue depth over time, not to CPU core count.
bash
# See what’s actually waiting for CPU
vmstat 1 10
# Look at the ‘r’ column (run queue)
# If ‘r’ consistently > number of cores = CPU saturation
# If ‘r’ is low but load is high = I/O wait
At scale, we track this every second. A sustained run queue above core count means you’re losing throughput to scheduling overhead.
System vs User CPU Time: The Kernel is Doing Too Much
Here’s a pattern I’ve seen destroy performance: an application with 70% CPU utilization that’s actually starving for cycles. How? Look at the breakdown:
User time: 20%
System time: 50%
That system time is the kernel working on behalf of your process—context switches, system calls, memory management, network stack processing. When system time dominates, your application is spending most of its time asking the OS to do things rather than doing actual work.
Production trigger: If sys% exceeds user% consistently, investigate with perf:
bash
# See exactly what the kernel is doing
perf top -g
# or record for 30 seconds
perf record -a -g -- sleep 30
perf report --stdio
At a major service, we traced 45% system time to excessive malloc/free calls. The fix wasn’t more CPU—it was object pooling to reduce memory management overhead.
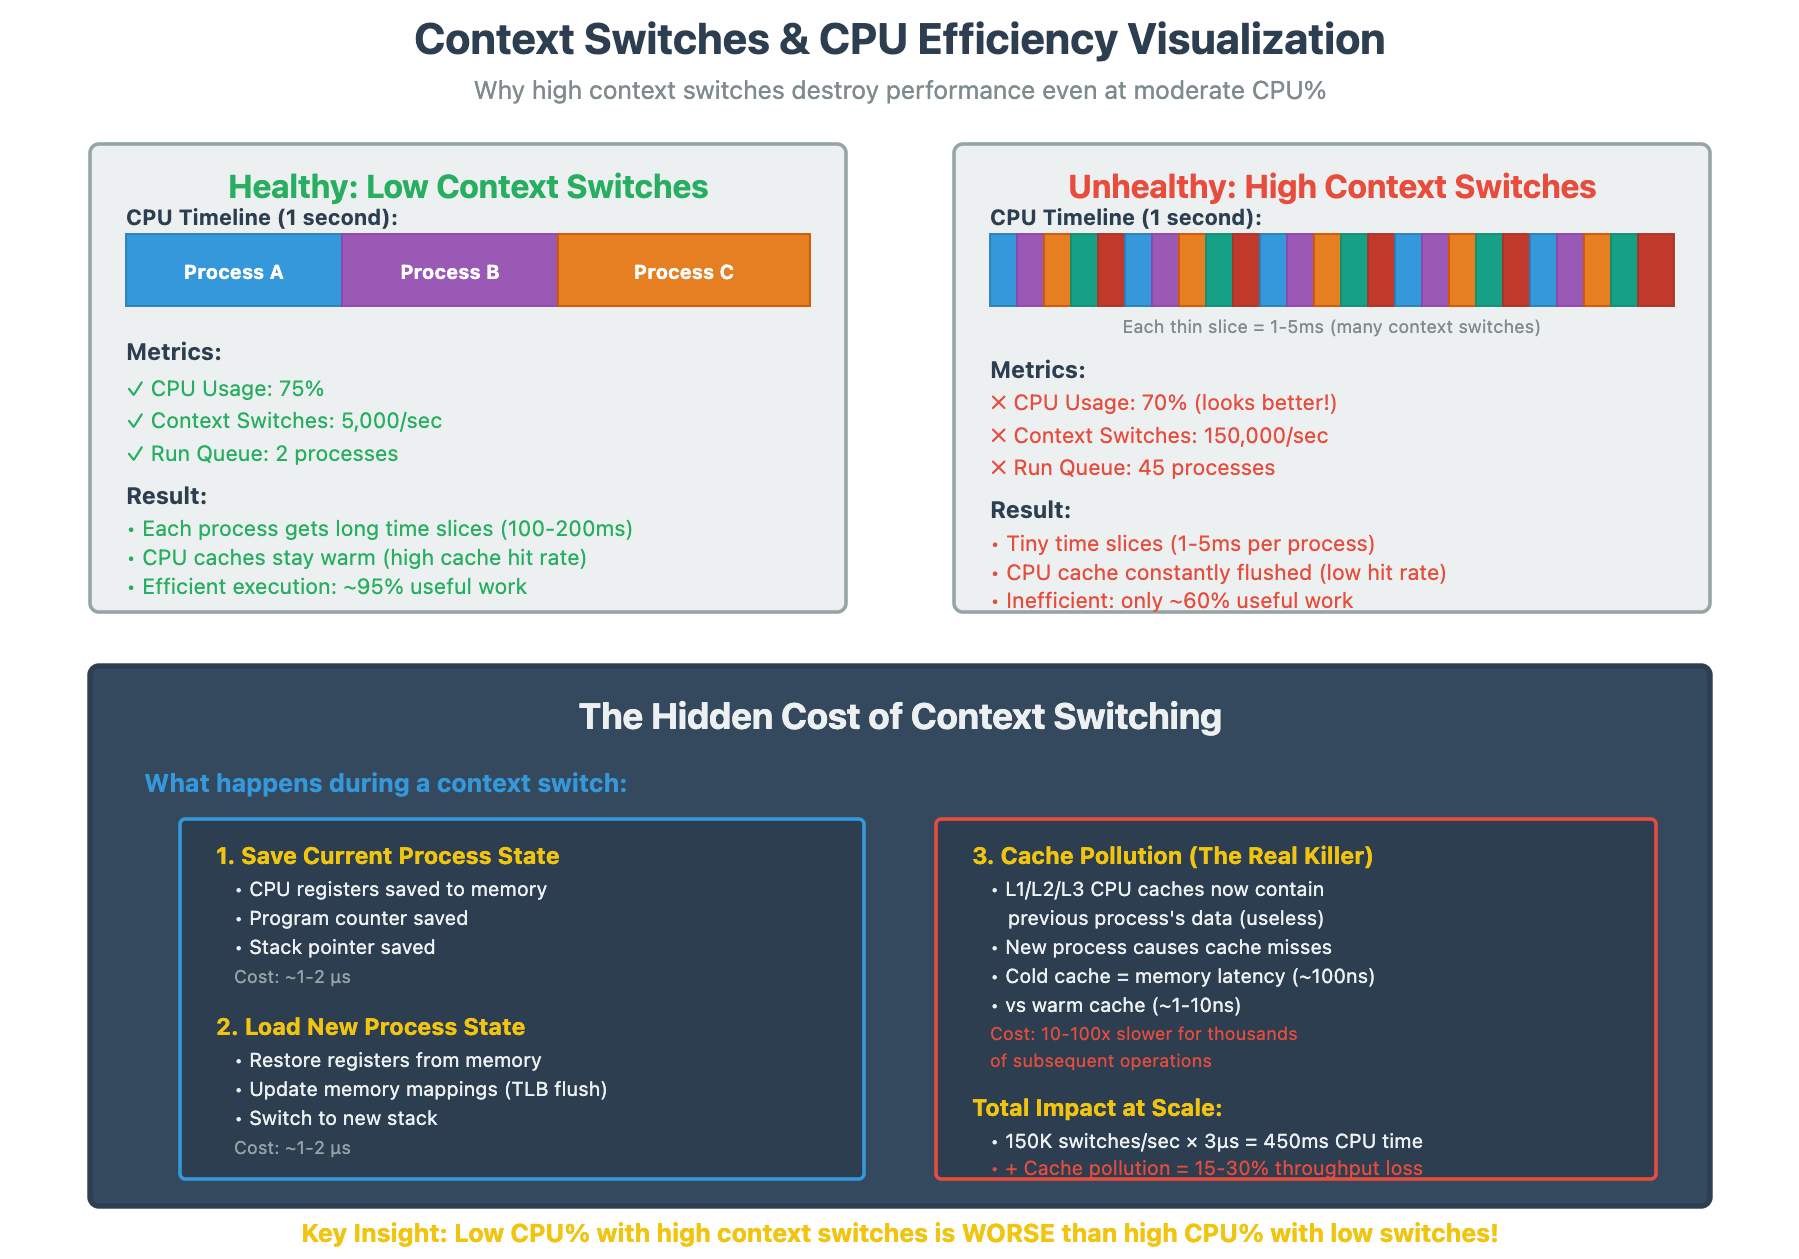
The Context Switching Time Bomb
This is the silent killer at scale. A server with 50% CPU and 100,000 context switches per second is in serious trouble. Each context switch costs time (microseconds add up), cache pollution (cold caches slow everything), and TLB flushes (virtual memory overhead).
The threshold that matters: Above 50,000 context switches/sec on modern hardware, you’re likely losing significant performance.
# Monitor context switches
pidstat -w 1 10
# Look at ‘cswch/s’ column per process

# System-wide view
vmstat 1
# Look at ‘cs’ column
Real scenario: We had a microservice handling 50K req/sec with acceptable latency. Traffic increased to 60K req/sec, and suddenly P99 latency exploded 5x. CPU was only at 70%. The culprit? Context switches jumped from 40K/sec to 150K/sec because the thread pool size was misconfigured, creating thread thrashing.
Fix pattern: Reduce context switches by using async I/O, appropriate thread pool sizing (not too many threads), and batching operations where possible.
CPU Steal Time: The Cloud Performance Thief
If you’re running in virtualized environments (AWS, GCP, Azure), st% (steal time) in top tells you when the hypervisor is giving your CPU cycles to other tenants. We’ve debugged situations where applications looked fast (low CPU usage), but latency was terrible—10-15% CPU steal time was the reason.
# Monitor steal time
mpstat -P ALL 1 10
# Look at ‘%steal’ column
Production threshold: Steal time above 5% consistently indicates your instance is oversold or undersized. Above 10%, you’re losing significant performance. The fix isn’t optimizing your code—it’s choosing different instance types or reserving capacity.
The IRQ Bottleneck at High Throughput
At 10M req/sec, we discovered something fascinating: CPU 0 was always at 100% while other CPUs were at 60%. The issue? All network interrupts were being handled by CPU 0. This is %irq and %soft in top—hardware and software interrupt time.
# See interrupt distribution
watch -n 1 ‘cat /proc/interrupts’

# Better tool for interrupt analysis
mpstat -I ALL 1Fix: IRQ affinity tuning and using network card features like RSS (Receive Side Scaling) to distribute interrupts across CPUs. This single change improved our throughput by 25%.
Part 2: Memory Troubleshooting - Understanding Linux’s Philosophy
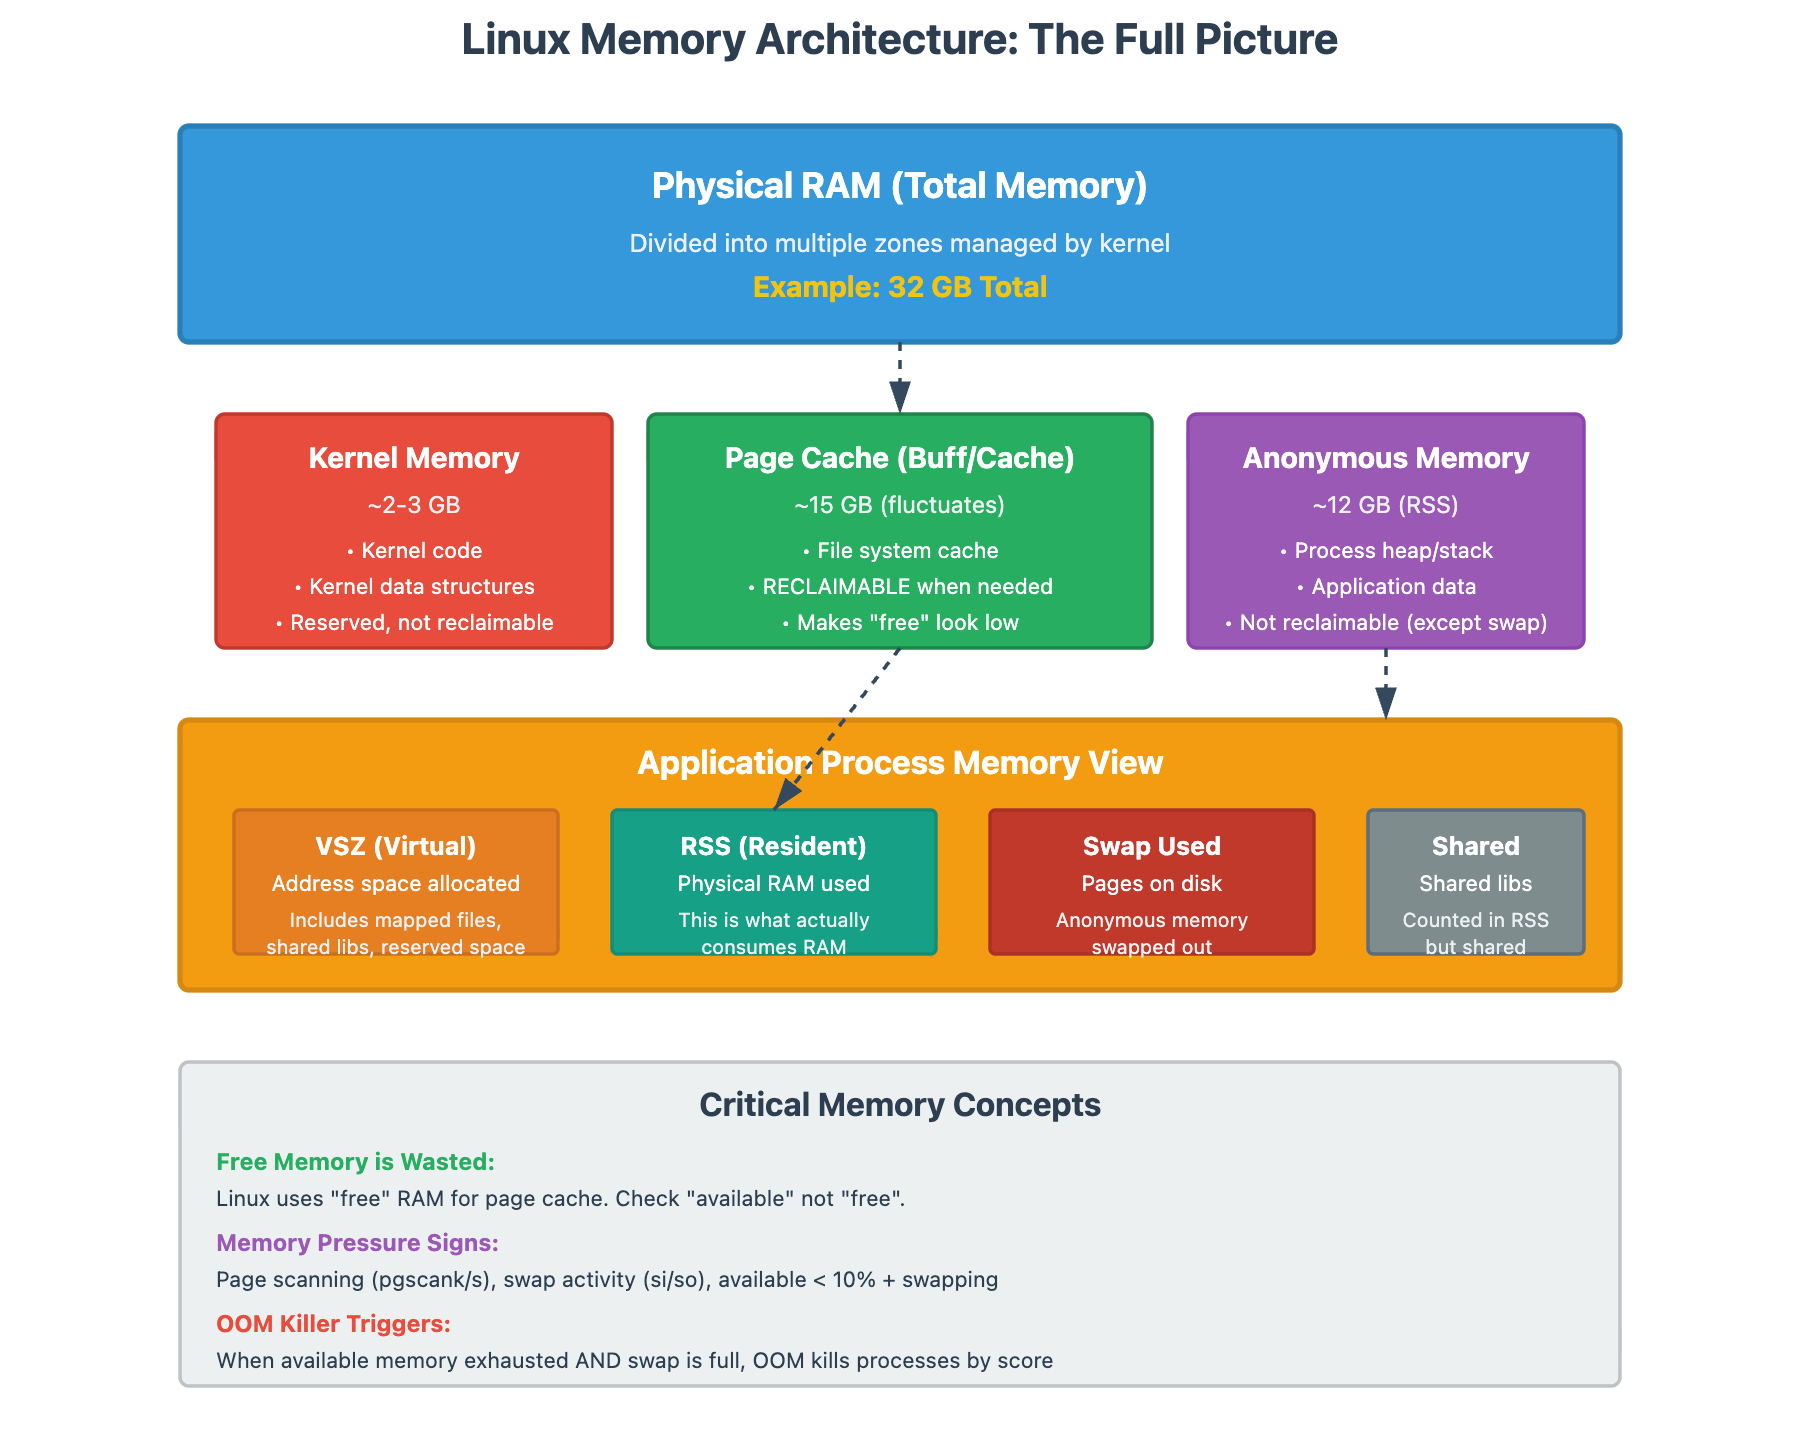
The “Free Memory is Wasted Memory” Principle
New engineers panic when they see this:
              total        used        free      shared  buff/cache   available
Mem:           32Gi        28Gi       500Mi       100Mi       3.5Gi        3.2Gi
“We’re using 28GB out of 32GB! We need more RAM!” Wrong. Linux intentionally uses memory for disk caching (buff/cache). The only number that matters is available, not free.
Key distinction:
free= completely unused memory (wasted opportunity)available= memory the kernel can give to applications when needed (this is what matters)
The kernel will automatically reclaim cache memory when applications need it. If available is consistently low (< 10% of total) AND you see paging activity, then you have memory pressure.
Memory Pressure: The Real Indicators
Here’s what actual memory pressure looks like:
bash
# Look at page scanning and reclaim activity
vmstat 1
# ‘si’ and ‘so’ columns (swap in/out) - should be near zero
# If you see consistent swap activity, you have pressure

# More detailed memory pressure indicators
sar -B 1 60
# Look at ‘pgscank/s’ and ‘pgscand/s’ (page scanning)
# If these are high, kernel is desperately looking for memory to reclaim
Production insight: We had a service with 20GB RAM, using 19.5GB, with 400MB available. Engineers wanted to upgrade to 32GB. But vmstat showed zero swap activity and minimal page scanning. The service ran for months without issues—the kernel was just efficiently using all available memory for cache.
RSS vs VSZ: What Your Process is Really Using
When someone says “our process is using 10GB,” I ask: “RSS or VSZ?”
VSZ (Virtual Size): Total virtual memory allocated (mostly meaningless)
RSS (Resident Set Size): Physical memory currently in RAM (what actually matters)
A process can have 50GB VSZ but only 2GB RSS. That’s because modern applications pre-allocate address space (VSZ) but only physically use (RSS) what they need.
bash
# See detailed memory usage per process
ps aux --sort=-%mem | head -20
# Look at ‘VSZ’ vs ‘RSS’ columns

# Even better breakdown
pmap -x <pid>
# Shows memory maps with RSS per region
The OOM Killer’s Algorithm: Why It Kills the Wrong Process
The Linux Out-Of-Memory killer uses a badness score to decide which process to terminate. Counterintuitively, it often kills your most important process because:
It’s using the most memory (high score)
It was started recently (high score)
It has a large number of threads (high score)
Your critical database? Probably first to die. Your monitoring agent that barely uses memory? Safe.
bash
# See OOM killer activity
dmesg | grep -i kill
journalctl -k | grep -i oom

# Check process OOM scores
cat /proc/*/oom_score | awk ‘{print $1}’ | sort -rn | head
Production fix: Set oom_score_adj for critical processes:
bash
# Protect critical processes (-1000 makes it immune to OOM killer)
echo -1000 > /proc/<pid>/oom_score_adj
# Or in systemd service files:
OOMScoreAdjust=-1000
Memory Leaks vs Memory Bloat: Know the Difference
A memory leak is when your process continuously allocates memory without freeing it—RSS grows unbounded over time. Memory bloat is when your process legitimately needs that memory due to workload growth or data accumulation.
How to tell:
Memory leak: RSS grows linearly over time regardless of workload
Memory bloat: RSS correlates with request rate or data size
bash
# Track RSS over time
pidstat -r -p <pid> 1 3600 > mem_tracking.txt
# Correlate with request rate from application metrics
Real case: A service’s RSS grew from 2GB to 8GB over a week. Logs showed gradual increase in cache entries due to more unique user sessions (legitimate growth). Once we implemented cache eviction policy, RSS stabilized at 4GB. Not a leak—just missing limits.
NUMA Awareness: The Scale Problem
On servers with multiple CPU sockets, memory is NUMA (Non-Uniform Memory Access). Accessing memory on the local NUMA node is fast; accessing remote nodes is slower. At scale, poor NUMA allocation destroys performance.
bash
# Check NUMA statistics
numastat
# Look for remote vs local access patterns

# See which NUMA node your process is using
numactl --hardware
numactl --show
If your process is allocated on NUMA node 0 but frequently accessing memory on node 1, you get latency penalties. The fix is pinning processes to specific NUMA nodes with matching memory allocation.
Part 3: I/O Troubleshooting - Finding the Real Bottleneck
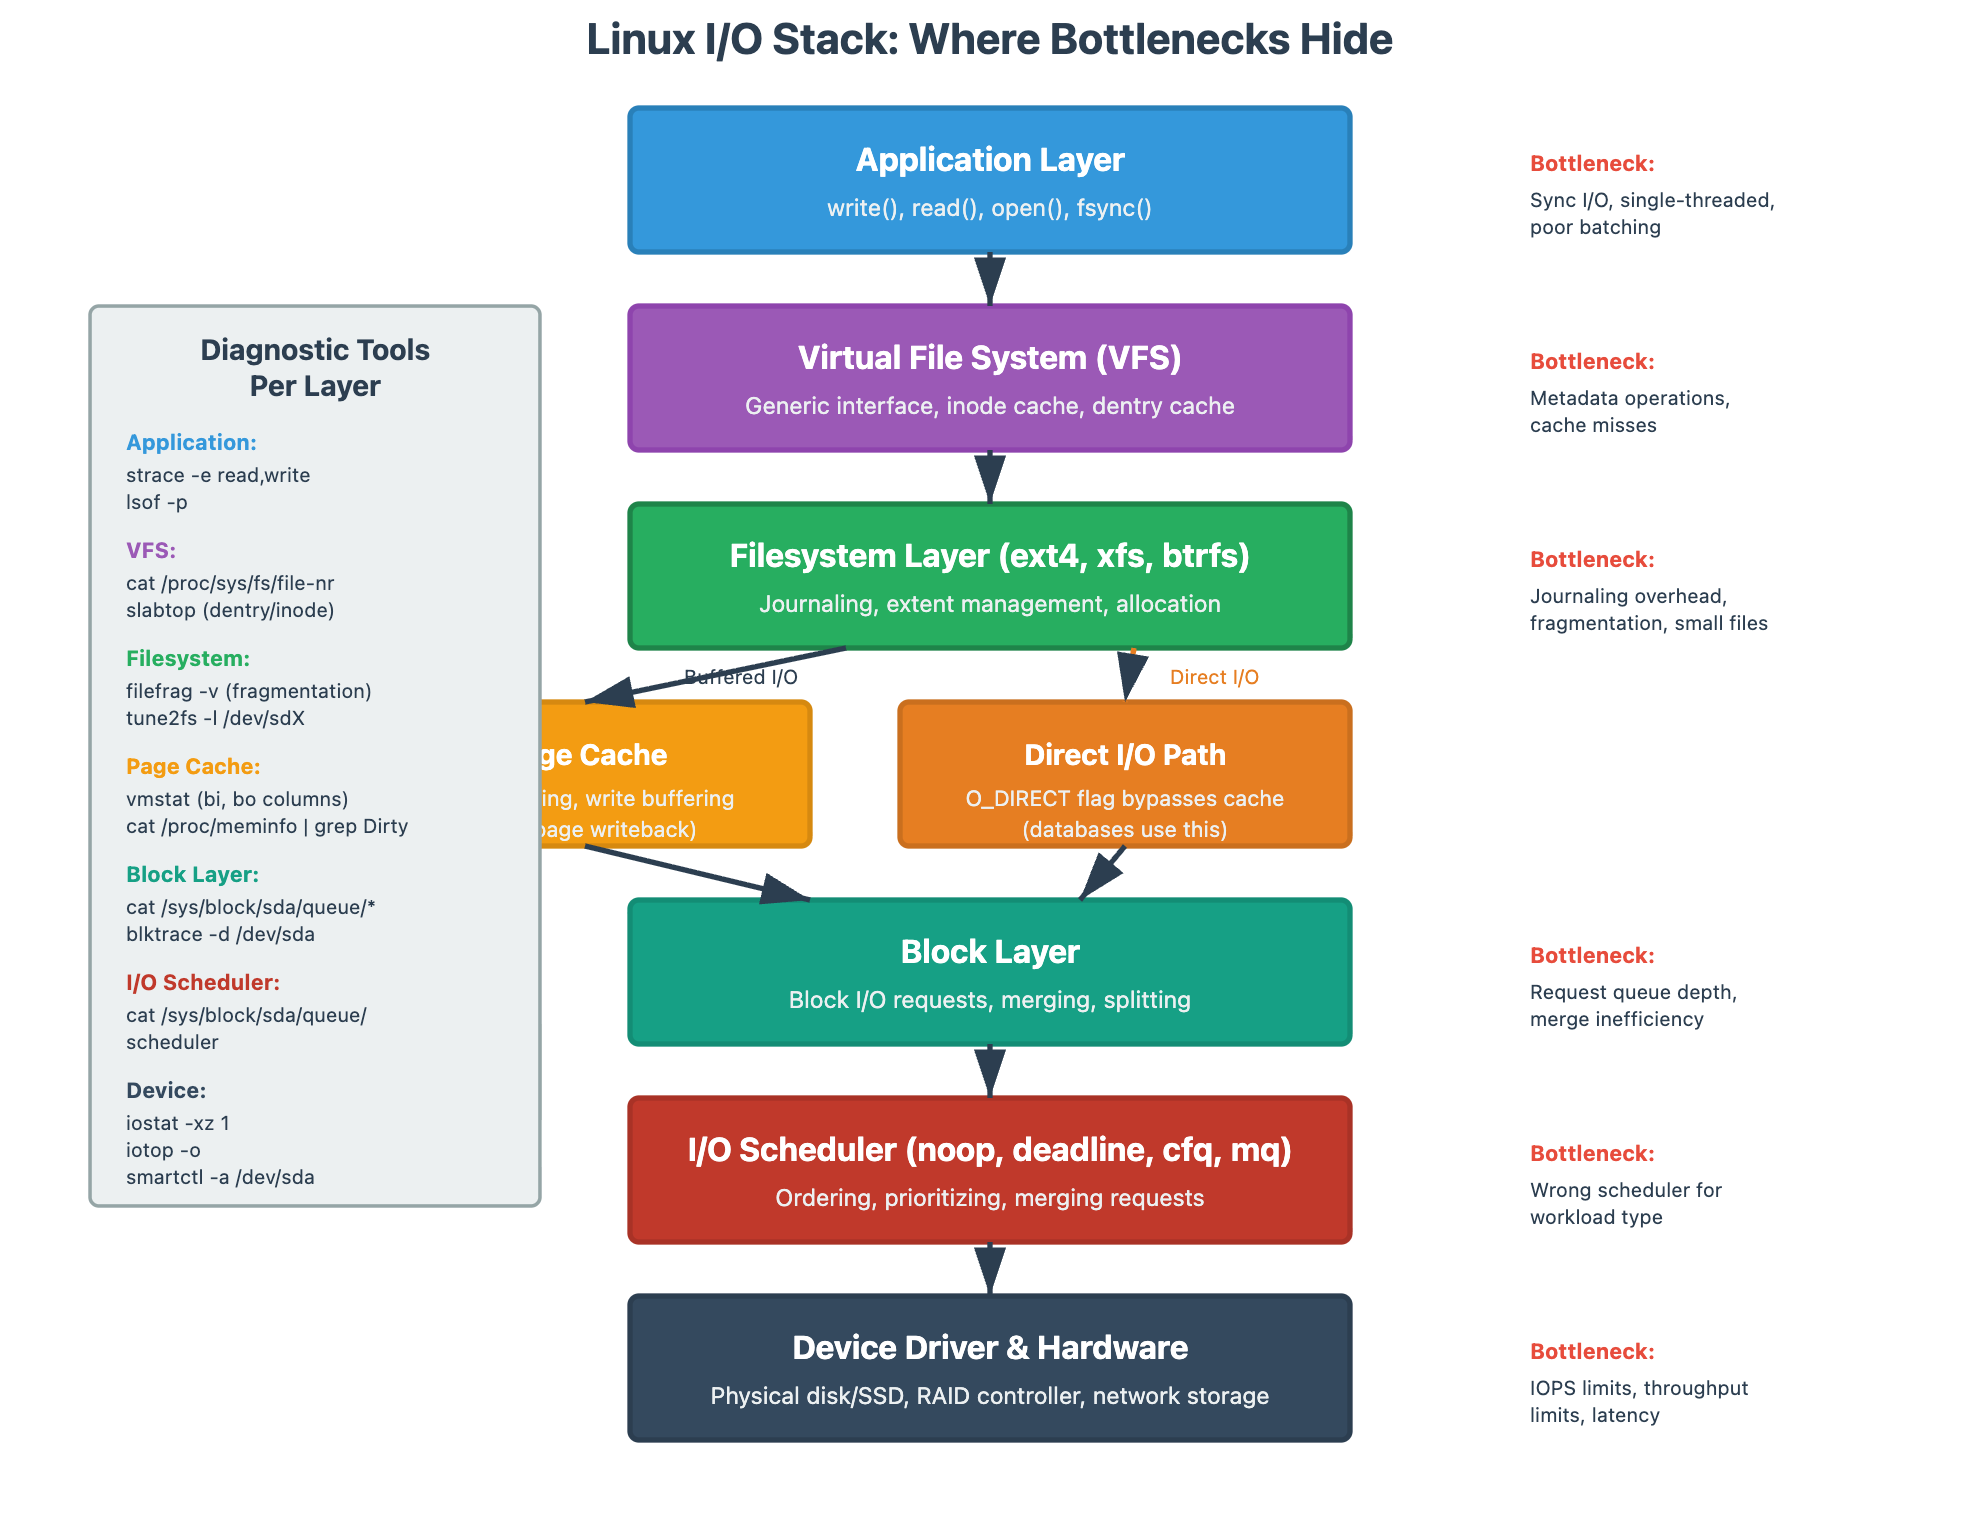
I/O Wait Time: The Most Misunderstood Metric
When someone says “we have 40% iowait, our disks are slow,” I know they don’t understand what iowait actually measures. I/O wait is idle CPU time while processes are blocked on I/O. It doesn’t tell you if your disks are slow—it tells you your CPUs are waiting for I/O operations to complete.
High iowait with low disk utilization? Your application is doing synchronous, single-threaded I/O. The disk can handle more, but your app isn’t giving it enough concurrent requests.
bash
# See the full picture
iostat -xz 1 10
# Look at ‘%util’ (disk busy time) along with iowait from top
# High iowait + low %util = application bottleneck
# High iowait + high %util = disk bottleneck
Real scenario: Service with 35% iowait, but disk %util was only 20%. The culprit? Application was reading files sequentially in a single thread. We parallelized reads across 4 threads, and suddenly iowait dropped to 8% while throughput tripled. Same disk, completely different performance.
IOPS vs Throughput: Pick Your Battles
Storage has two primary limitations:
IOPS: Operations per second (4K random reads/writes)
Throughput: MB/s (sequential reads/writes)
Most applications hit IOPS limits before throughput limits. SSDs can handle hundreds of thousands of IOPS but only 1-3GB/s throughput. Spinning disks can provide 150MB/s throughput but only 100-200 IOPS.
bash
# See both metrics
iostat -xz 1
# ‘r/s’ and ‘w/s’ = IOPS
# ‘rMB/s’ and ‘wMB/s’ = throughput

# Track per-process I/O
iotop -o
# Shows which processes are doing I/O
Pattern recognition:
Small random reads/writes = IOPS bound
Large sequential operations = throughput bound
Database queries with indexes = IOPS bound
ETL batch loads = throughput bound
At scale, we redesigned a reporting system to batch small reads into fewer large reads, reducing IOPS by 80% while maintaining the same throughput.
Disk Queue Depth and Saturation
Queue depth tells you how many I/O operations are waiting for the disk. When queue depth is consistently high, you’re saturating your storage.
bash
iostat -xz 1
# Look at ‘avgqu-sz’ column
# Queue depth > 10 consistently = saturation
Real case: A database had avgqu-sz of 45. Queries were taking 500ms that should take 50ms. We analyzed the I/O patterns and discovered that indexes were on the same volume as data, creating contention. Separating them onto different volumes (different queue depths) dropped query latency by 70%.
The Write-Back Cache Trap
Linux buffers writes in memory before flushing to disk (write-back cache). This makes writes appear fast in your application, but eventually the kernel must flush dirty pages. When dirty page thresholds are hit, the kernel becomes aggressive about flushing, and suddenly your fast writes become slow.
bash
# Monitor dirty pages
watch -n 1 ‘cat /proc/meminfo | grep Dirty’
# If Dirty pages are high (>5% of RAM), flushes will hurt

# See write patterns
vmstat 1
# ‘bo’ column (blocks out) shows write activity
Production configuration: Tune /proc/sys/vm/dirty_* parameters to control flush behavior. For databases with write-heavy workloads, we set aggressive flushing to prevent sudden stalls:
bash
# Flush more often but more gently
vm.dirty_background_ratio = 5
vm.dirty_ratio = 10
Block Layer vs Filesystem: Where’s the Bottleneck?
An I/O operation travels through multiple layers: Application → VFS → Filesystem (ext4, xfs) → Block layer → Disk scheduler → Physical device. Each layer can be the bottleneck.
bash
# See block layer statistics
cat /sys/block/sda/stat
# Detailed I/O timing per device

# Filesystem-level monitoring
filefrag -v <file>
# Check file fragmentation (fragmented files = poor performance)

# Active disk operations
cat /proc/diskstats
Common pattern: Filesystem metadata operations (creating/deleting many small files) can bottleneck on inode operations rather than data I/O. We’ve seen situations where %util is 40% but the filesystem is saturated due to directory operations.
Network I/O Masquerading as Disk I/O
In distributed systems with network-mounted storage (NFS, Ceph, distributed databases), what looks like disk I/O might be network I/O. You’ll see iowait, but the actual bottleneck is network latency or packet loss.
bash
# Distinguish local vs network I/O
netstat -s | grep -i error
# Packet errors indicate network issues

# Monitor network-mounted filesystem performance
nfsstat
# For NFS specifically
Production lesson: We spent days optimizing disk I/O on a service before realizing it was reading from network-mounted storage. Network packet retransmissions were causing 200ms of latency per read. Switching to local caching dropped I/O wait from 25% to 2%.
Part 4: Integrated Troubleshooting Methodology
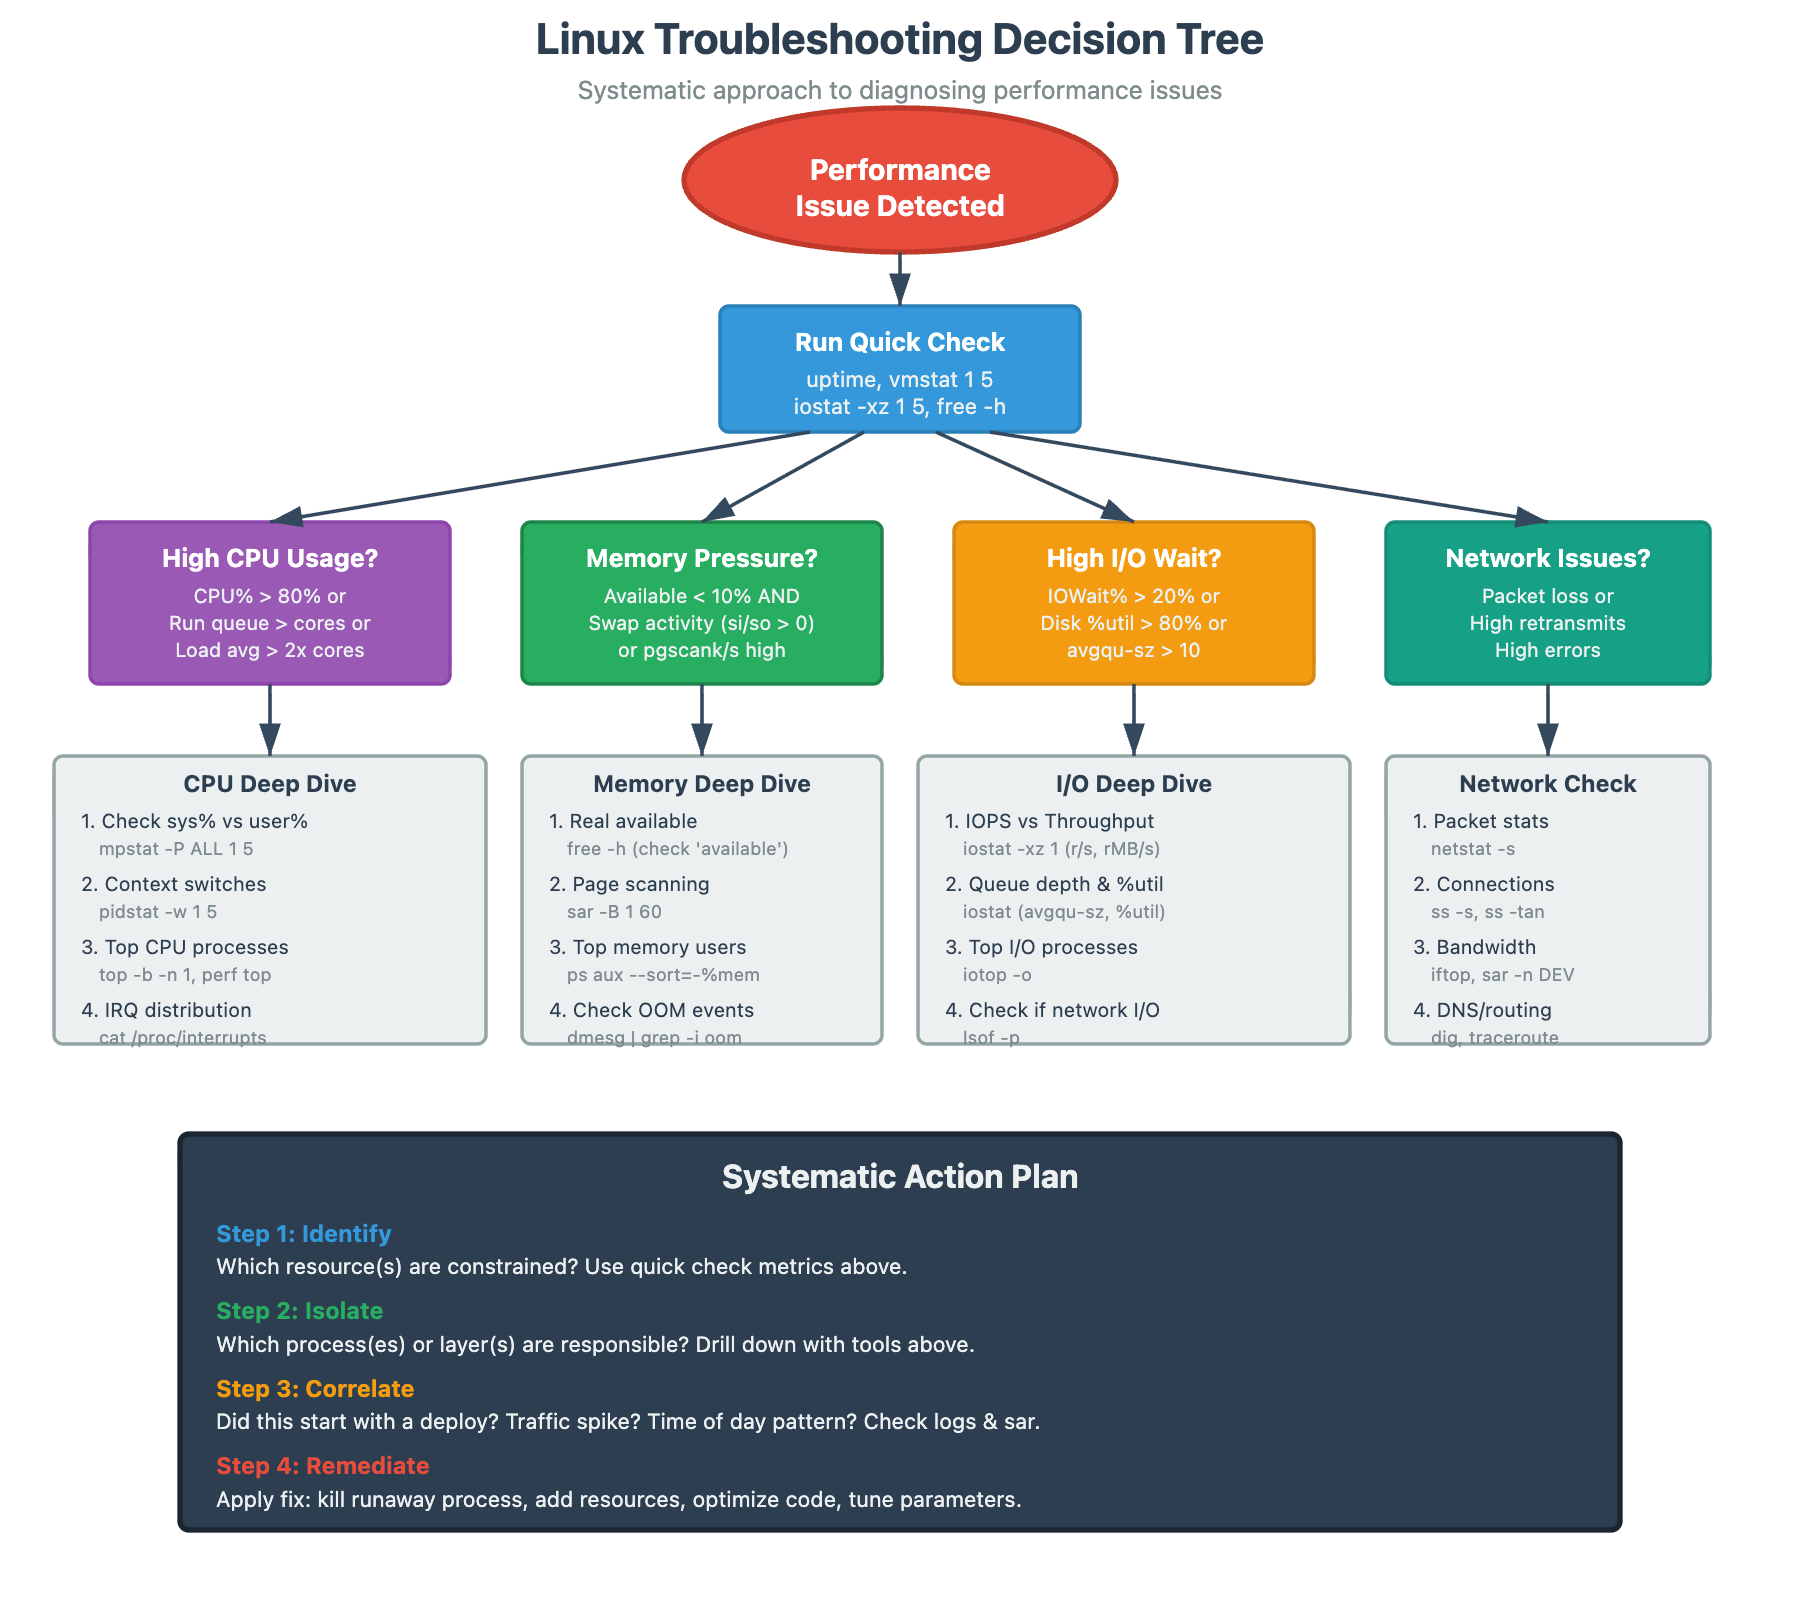
The Five-Step Production Diagnosis
When a performance issue hits, follow this sequence:
Step 1: Baseline Assessment (30 seconds)
bash
# Get the big picture
uptime                    # Load average trend
vmstat 1 5               # System-wide health
iostat -xz 1 5           # I/O health
free -m                  # Memory state
Look for obvious anomalies: load > 2x cores, high swap activity, disk %util > 80%, available memory < 10%.
Step 2: Process-Level Investigation (2 minutes)
bash
# Find the culprit processes
top -b -n 1              # Overall CPU/Memory hogs
pidstat -d 1 5           # Which processes are doing I/O
pidstat -w 1 5           # Context switches per process
ps -eo pid,comm,args,pcpu,pmem --sort=-pcpu | head -20
Identify if one process is dominating resources or if it’s systemic.
Step 3: Deep Dive on Suspect (5 minutes)
bash
# For high CPU process:
perf top -p <pid>        # What functions are using CPU
strace -c -p <pid>       # Which syscalls and their frequency

# For high memory process:
pmap -x <pid>            # Memory map details
cat /proc/<pid>/smaps    # Detailed memory breakdown

# For high I/O process:
lsof -p <pid>            # What files are open
strace -p <pid> -e trace=read,write  # Real-time I/O activity
Step 4: Historical Correlation (3 minutes)
bash
# Look at trends
sar -u 1 60              # CPU over last hour
sar -r 1 60              # Memory over last hour
sar -d 1 60              # Disk over last hour
Is this a gradual degradation or sudden spike? Correlate with deploy times, traffic patterns, batch jobs.
Step 5: Hypothesis Testing (varies)
Based on findings, form a hypothesis and test:
High context switches → reduce thread pool size → measure
Memory pressure → add swap or identify memory hogs → measure
I/O saturation → check if IOPS or throughput bound → optimize accordingly
Correlation Over Causation
The biggest troubleshooting mistake is seeing two things happen together and assuming one causes the other. High CPU and slow requests might both be symptoms of something else (like network issues causing retries).
Always ask: “What would cause BOTH these symptoms?”
Real example: High CPU + high disk I/O + high memory usage. The actual cause? A runaway log file that grew to 200GB. The application was reading this log file (high I/O), parsing it in memory (high memory), and processing it (high CPU). Fixing the log rotation solved all three symptoms.
Part 5: Production-Ready Takeaways
Your Troubleshooting Toolkit
Keep these commands aliased and ready:
bash
# Quick health check
alias health=’echo “=== Load ===” && uptime && echo “=== CPU ===” && mpstat 1 1 && echo “=== Memory ===” && free -h && echo “=== Disk ===” && iostat -xz 1 1’

# Process investigation
alias topcpu=’ps aux --sort=-%cpu | head -20’
alias topmem=’ps aux --sort=-%mem | head -20’
alias topio=’iotop -o -b -n 1’

# Historical analysis
alias hist=’sar -u 1 60 & sar -r 1 60 & sar -d 1 60’
Thresholds That Matter at Scale
From operating 10M req/sec systems, these are the thresholds where we take action:
CPU: Run queue depth > cores for >30 seconds
Context switches: >50K/sec consistently
CPU steal: >5% (cloud environments)
System CPU: sys% > user% for >1 minute
Memory: Available < 10% AND active swapping
Disk %util: >80% for >30 seconds
Disk queue depth: >10 sustained
IOPS: >70% of device maximum
Network errors: >0.1% packet loss or retransmissions
The Meta-Skill: Building Intuition
After thousands of production incidents, the real skill isn’t knowing commands—it’s pattern recognition. You develop an intuition for what “feels wrong” in the data.
Sawtooth memory patterns often indicate memory leaks
Sudden CPU spikes at regular intervals suggest cron jobs or batch processes
Gradual I/O degradation over days points to fragmentation or growing data sets
High load with low CPU suggests I/O or lock contention
Practice this: Set up a test environment and intentionally create issues (memory leak, CPU hog, I/O saturation). Observe the metrics. You’ll start recognizing the signatures of different failure modes.
When to Stop Optimizing
Perfect is the enemy of good. We’ve wasted weeks optimizing from 100ms to 90ms when the business didn’t need it. Know your SLOs:
If P99 < target: Stop
If throughput > requirements: Stop
If cost < budget: Stop
The best engineers know when optimization provides business value and when it’s just intellectual exercise.
Conclusion: From Metrics to Mastery
Linux troubleshooting isn’t about memorizing commands—it’s about understanding the layered systems, recognizing patterns, and building mental models of how the kernel manages resources under pressure.
The metrics you see—CPU %, memory usage, disk I/O—are just shadows on the wall. The real story is in the interactions: how many processes are truly waiting, whether memory pressure is genuine or artificial, and where I/O is actually bottlenecked in the stack.
You’ve now learned to:
Read beyond surface metrics to understand true system health
Distinguish between similar-looking symptoms with different root causes
Apply a systematic methodology that scales from single servers to distributed systems
Recognize when to deep-dive vs when to take immediate action
The next time you’re troubleshooting a performance issue, you won’t just run top and hope. You’ll have a mental map of the system, hypotheses to test, and the tools to prove what’s really happening. That’s the difference between a junior engineer who can google commands and a senior engineer who can debug production under pressure.
Now go break some test environments on purpose. The best way to learn troubleshooting is to create problems and observe their signatures. You’ll thank yourself the next time production is on fire.