Tail Latency (P99) Optimization: Why Averages Lie and How to Fix Outliers
Your API’s average response time is 50ms. Looks great on the dashboard. But 1 in 100 requests takes 5 seconds, and those users are furious. Welcome to the tail latency problem—where averages hide the pain that matters most.
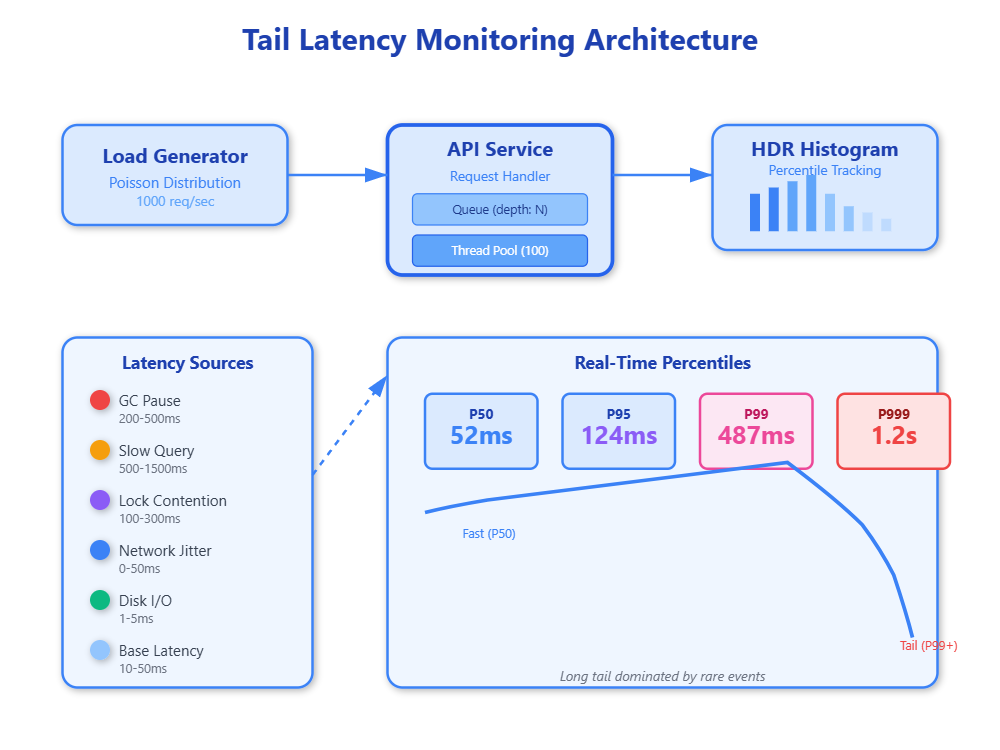
Tail latency refers to response times in the long tail of the distribution, typically measured at P99 (99th percentile), P999 (99.9th percentile), or even P9999. When you measure only averages, you’re blind to the outliers that define user experience. A user hitting your API 100 times will likely encounter that awful 5-second delay. At scale, “rare” events happen constantly—1% of a billion requests is still 10 million angry users.
How Tail Latency Emerges
Tail latency doesn’t come from a single cause. It’s the confluence of multiple system behaviors compounding at the worst possible moment.
Queueing Theory and Head-of-Line Blocking:
When a system approaches 70-80% CPU utilization, queue depths explode exponentially due to Little’s Law. A slow request at the head of a queue blocks everything behind it. If your thread pool has 100 threads and 3 get stuck on slow database queries, those 3% of threads can cascade into 30% of requests experiencing delays. This is why keeping utilization below 70% is critical in production systems—the margin between “fast” and “disaster” is razor-thin.
Garbage Collection Pauses:
In JVM-based systems, full GC pauses can freeze all application threads for 500ms to several seconds. These pauses are deterministic in that they will happen, but unpredictable in timing. A P99 measurement often captures GC pauses rather than actual business logic performance. Systems handling 10,000 RPS will see 100 requests hit during a 10ms GC pause, all experiencing identical latency spikes.
Disk I/O and Page Cache Misses:
Even with SSDs, a cache miss forcing disk read adds 1-5ms. When your working set exceeds available RAM, the kernel evicts pages, and subsequent access triggers blocking disk I/O. Under memory pressure, P99 latencies can jump 50-100x as synchronous reads block request processing threads.
Network Congestion and Packet Loss:
TCP packet loss triggers exponential backoff, turning a 1ms network hop into 200ms+ retransmit delay. At cloud scale, cross-zone traffic experiences packet loss rates of 0.1-1%, enough to spike tail latencies regularly. A single dropped packet in a 10-packet response can double response time.
Lock Contention and Synchronization:
When multiple threads compete for locks, the unlucky thread waiting for a lock held during a GC pause or slow I/O experiences cumulative delays. Lock contention is non-linear—going from 2 to 3 threads contending can triple wait times due to scheduling overhead and thundering herd effects.