
TLS Handshake Latency: When Your Load Balancer Becomes a Bottleneck
You’ve scaled your backend services, tuned your databases, and optimized your API responses. But users are still complaining about slow initial page loads. Your monitoring shows something weird: connection establishment time is spiking to 5+ seconds during peak traffic, even though your network latency is fine. Welcome to the world of TLS handshake saturation.
The Problem Nobody Talks About
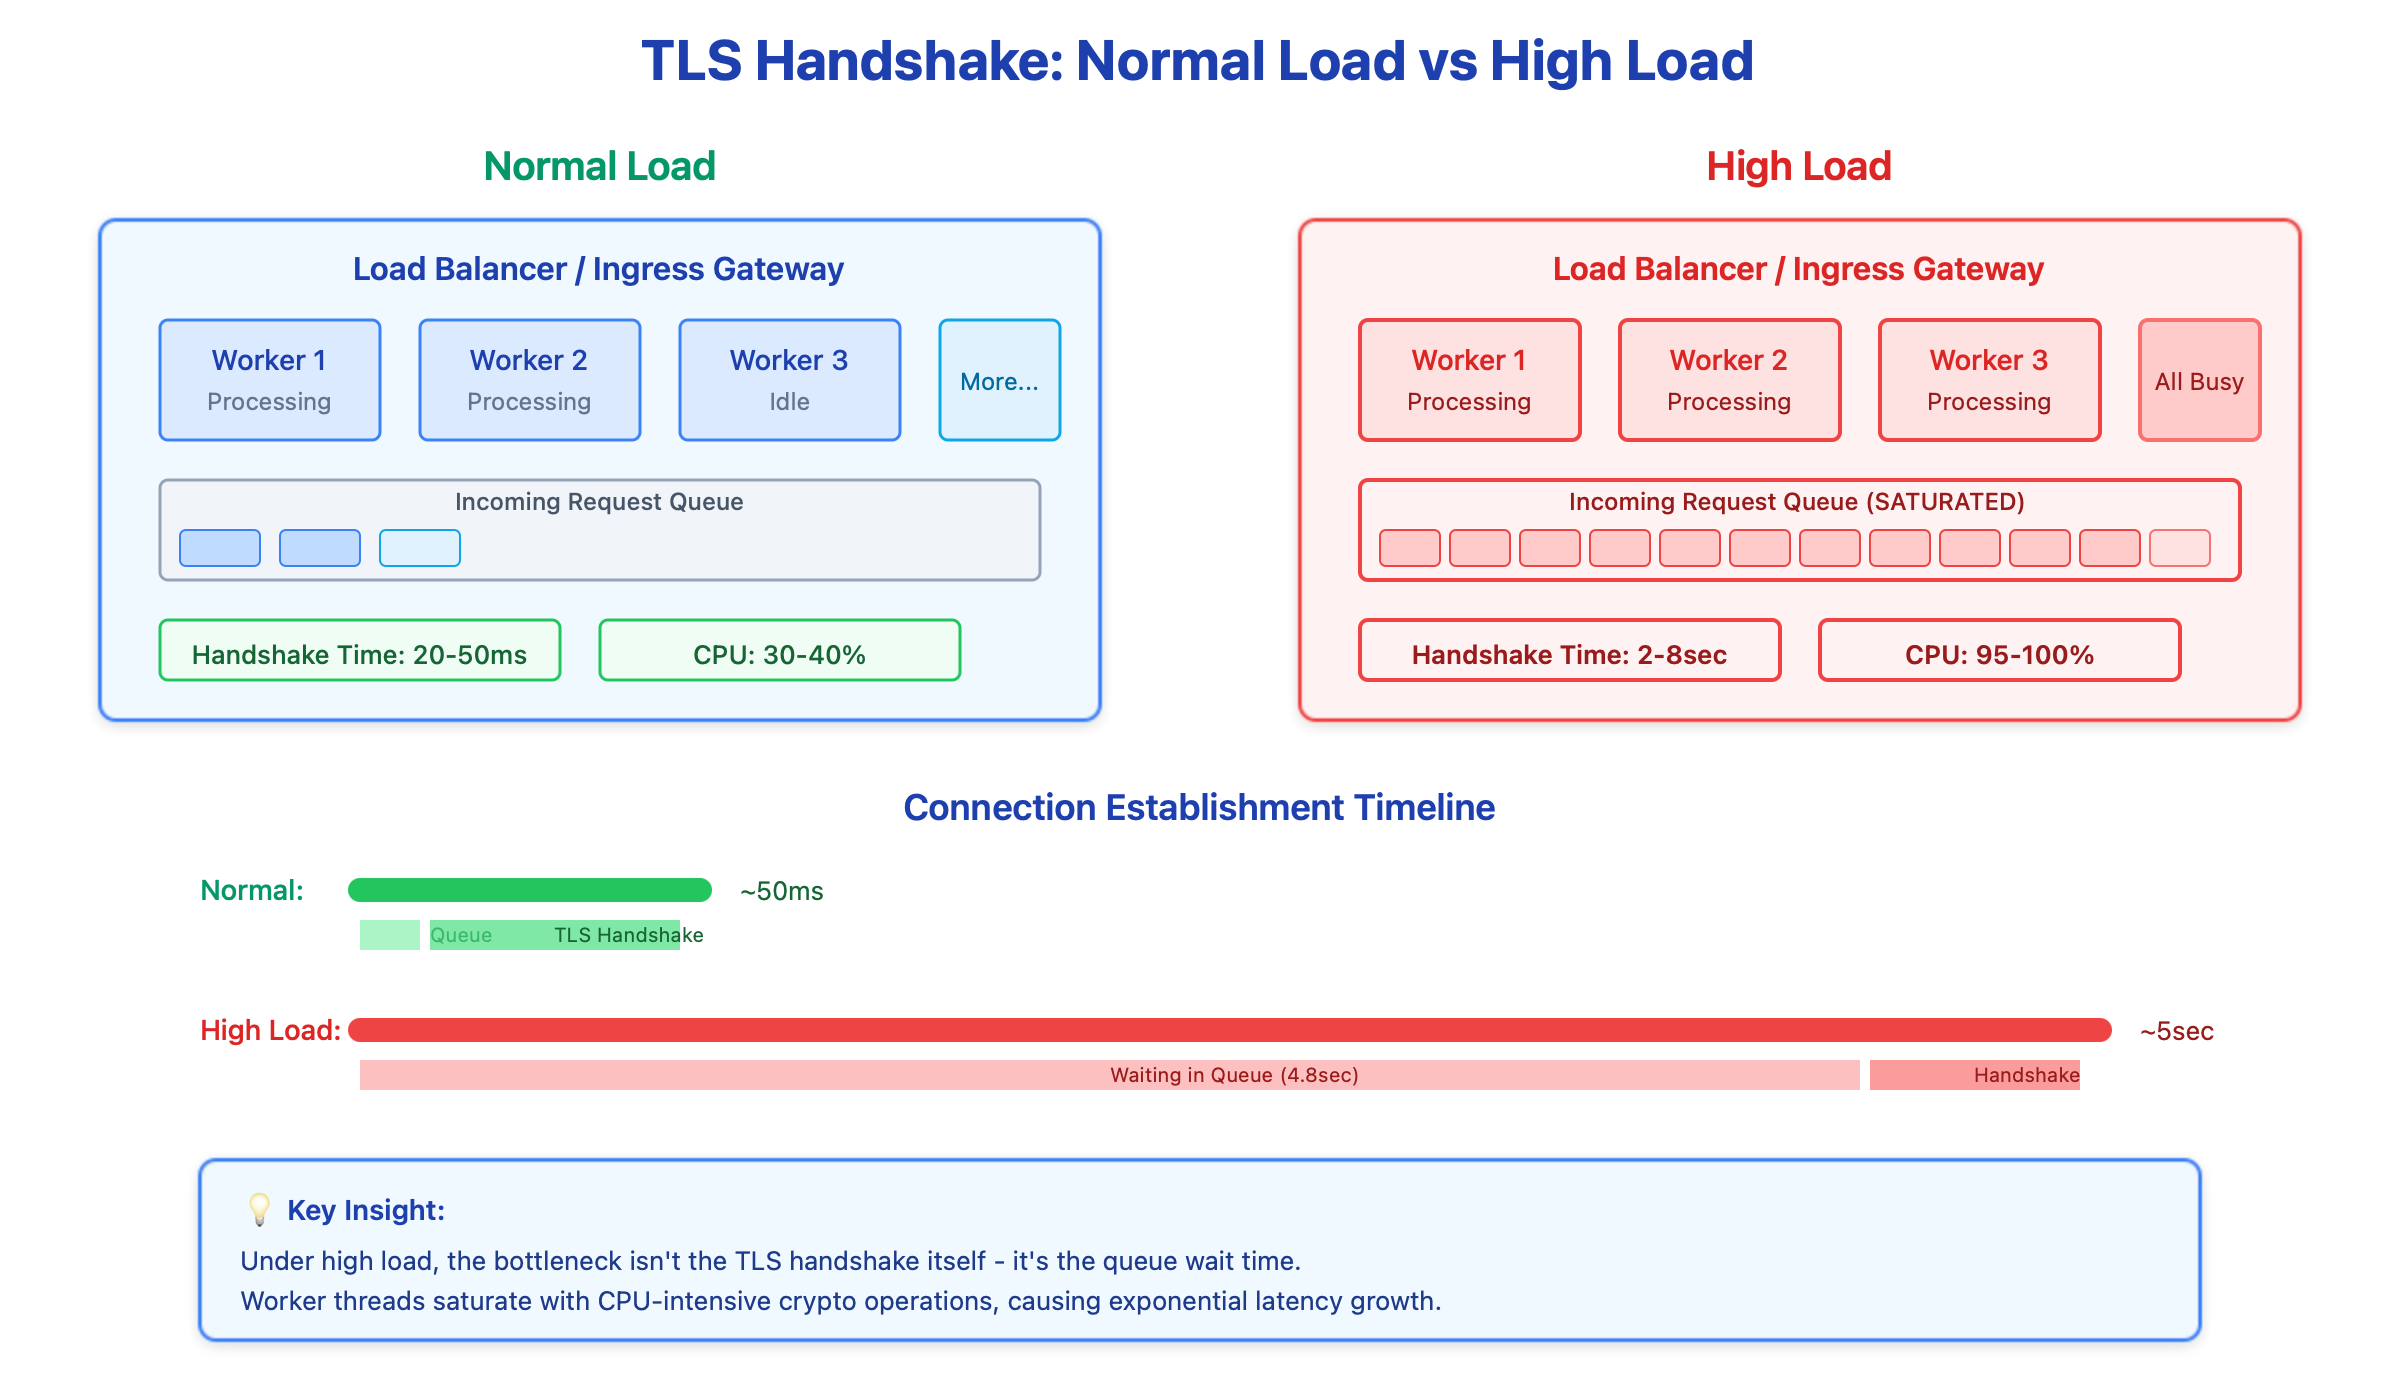
Most engineers think of TLS as network overhead - a few extra round trips that add maybe 50-100ms. But here’s what actually happens: when your load balancer receives a new HTTPS connection, it needs to perform CPU-intensive cryptographic operations. We’re talking RSA signature verification, ECDHE key exchange calculations, and symmetric key derivation. On a quiet Tuesday morning, each handshake takes 20-30ms. During a traffic spike? That same handshake can take 5 seconds.
The culprit is queueing. Your load balancer has a fixed number of worker threads handling TLS operations. When requests arrive faster than workers can process them, they queue up. Now you’re not just dealing with the crypto overhead - you’re dealing with wait time in a saturated queue. I’ve seen production load balancers at major tech companies go from 50ms p99 handshake latency to 8 seconds during deployment events when thousands of connections need re-establishment simultaneously.
The Cascading Failure You Don’t See Coming
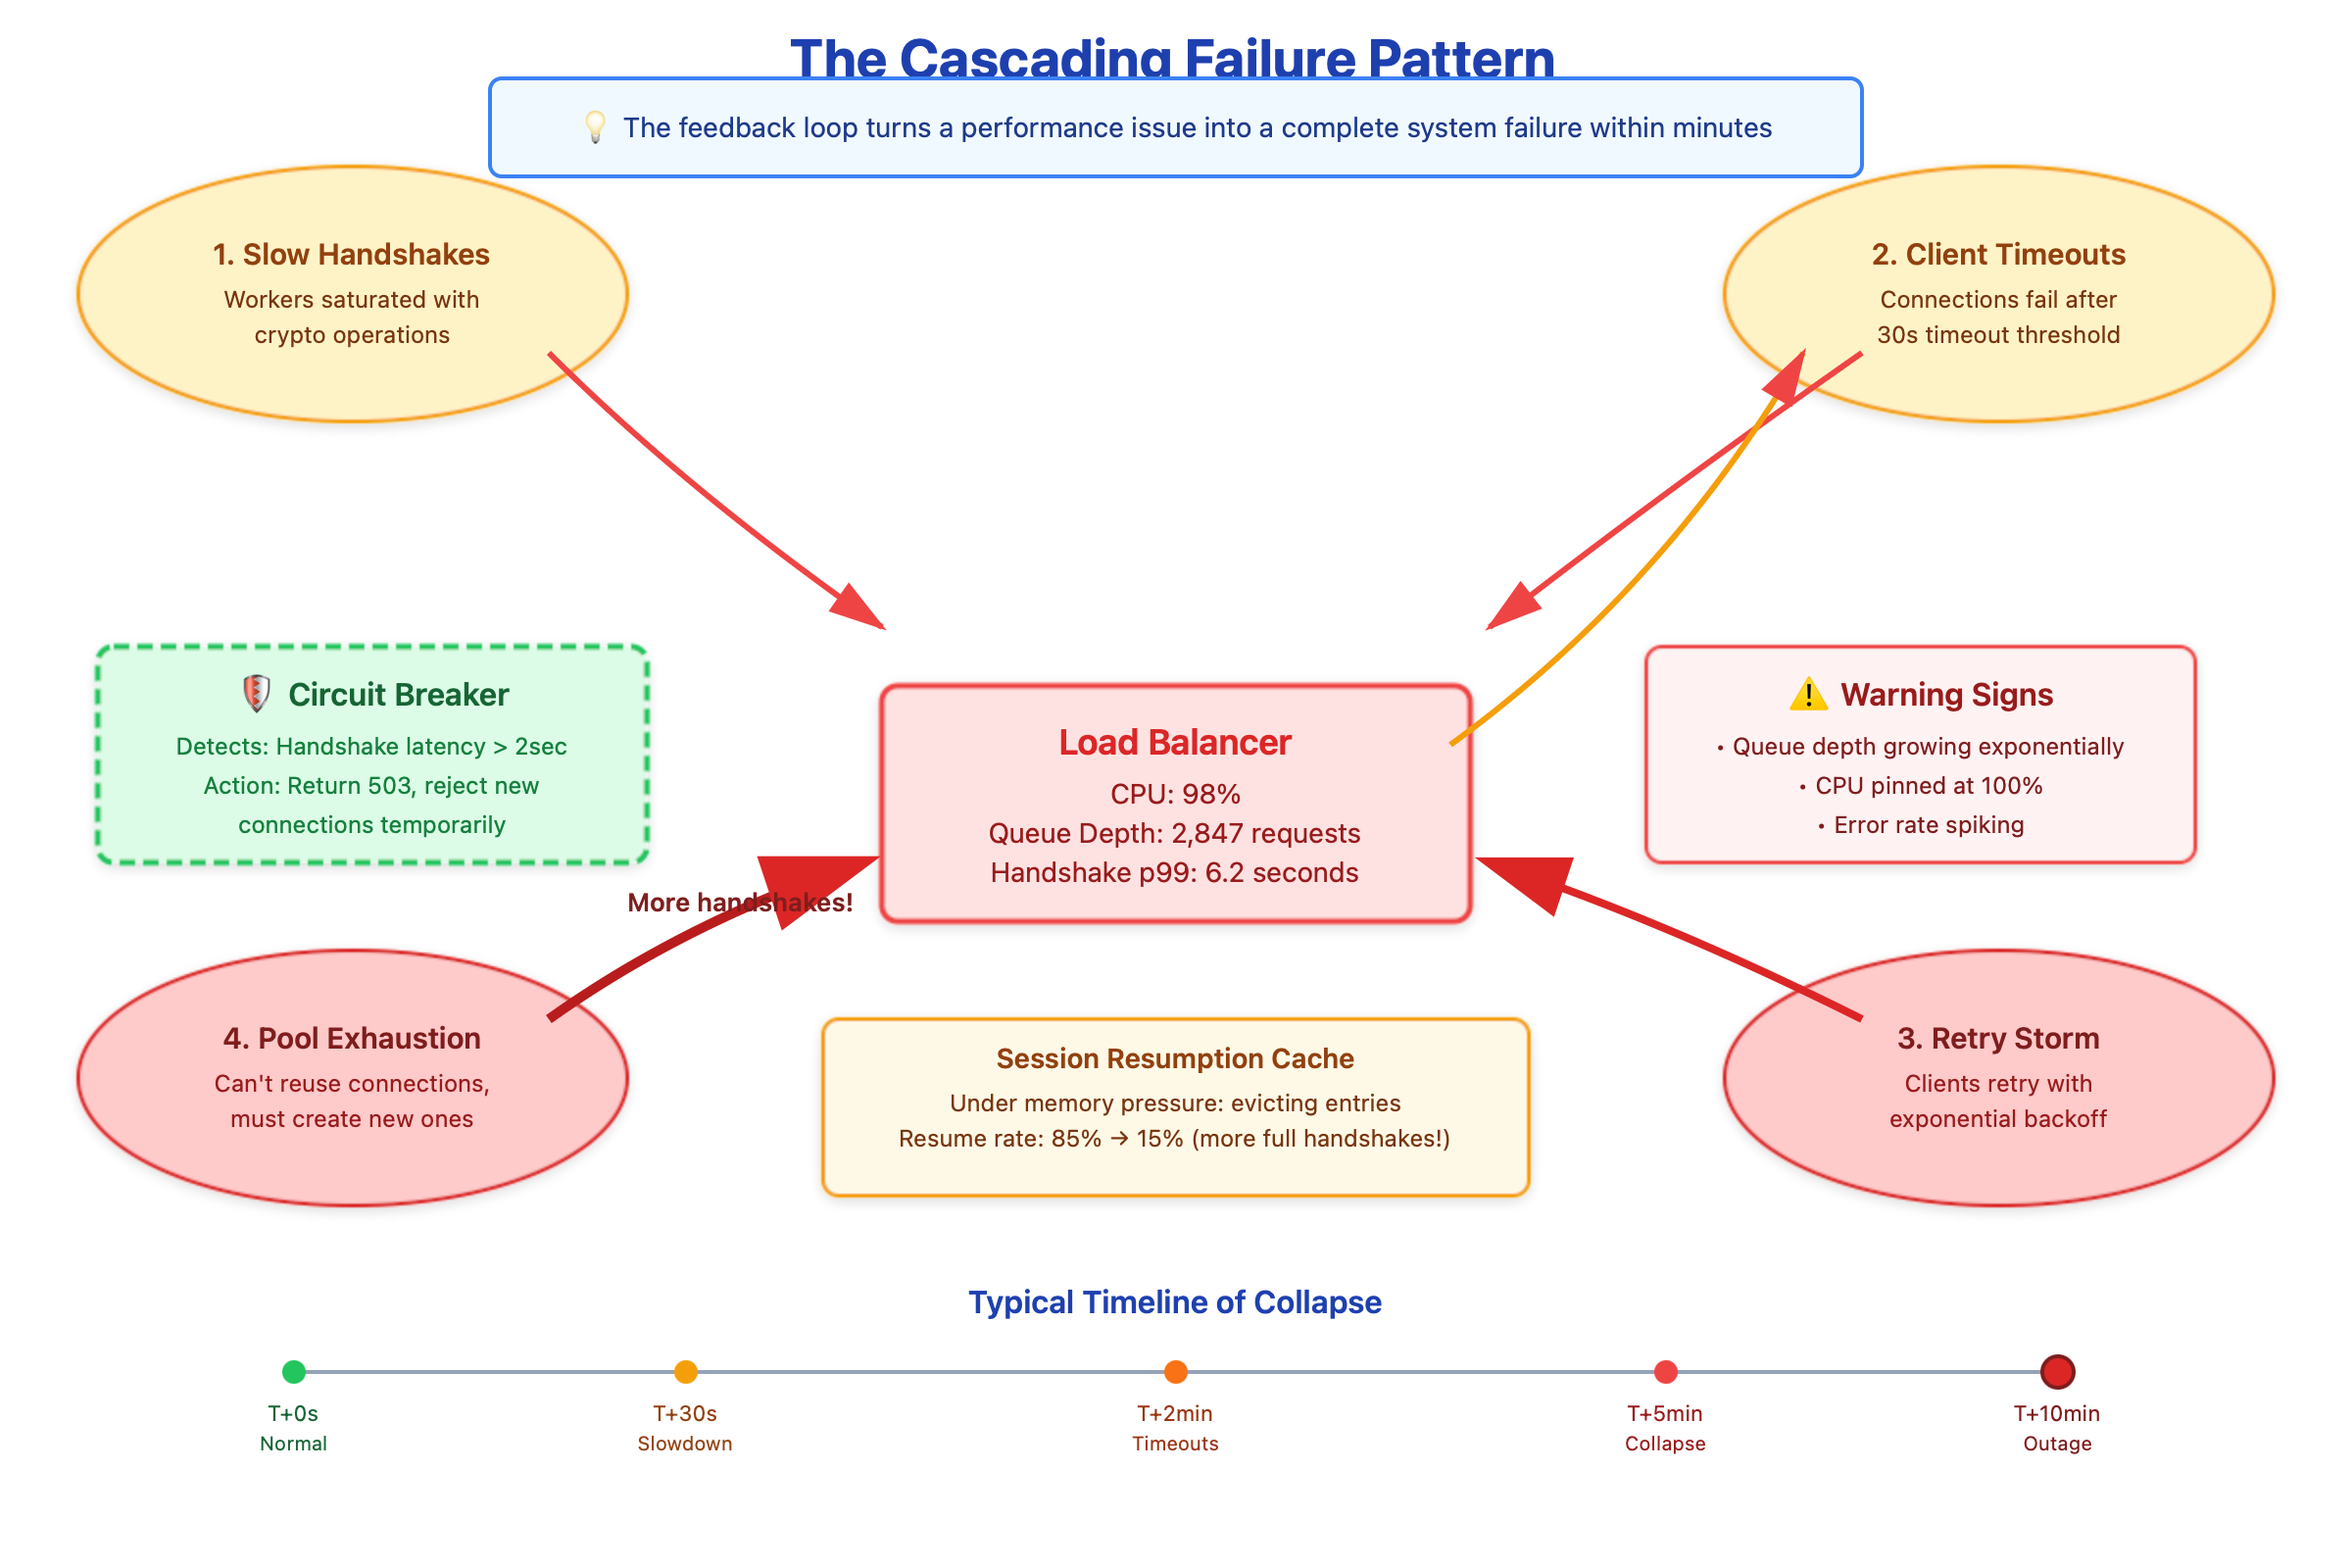
Here’s where it gets nasty. When handshakes slow down, clients start timing out. Most HTTP clients have a 30-second connection timeout, but mobile clients might use 10 seconds. When they timeout, what do they do? Retry. Now you’ve got the original slow handshakes plus a wave of retry attempts. Your load balancer’s CPU usage hits 100%, and every new connection attempt just makes it worse.
But there’s a deeper problem that catches people off guard: session resumption stops working under load. TLS session tickets are supposed to shortcut the handshake by caching the negotiated keys. In theory, a resumed session skips the expensive key exchange. In practice, when your session cache is under memory pressure or your worker threads are saturated, even “fast” resumed sessions start queueing behind full handshakes. I’ve debugged incidents where session resumption success rate dropped from 85% to 15% purely due to cache eviction pressure during load spikes.
The feedback loop is vicious. Slow handshakes lead to connection pool exhaustion in your clients. When pools are exhausted, applications can’t reuse connections and must establish new ones. More new connections mean more handshakes, which increases queue depth, which slows everything further. You end up in a state where your load balancer is processing handshakes as fast as it can, but the queue just keeps growing.
What Big Companies Actually Do
Netflix maintains minimum connection pool sizes even during low traffic periods. They use predictive scaling to pre-establish thousands of TLS connections 10 minutes before they release a new show. This “connection prewarming” means when the traffic spike hits, most clients already have warm connections and don’t need new handshakes.
Cloudflare uses eBPF programs to filter obviously malicious handshake attempts at line rate before they reach userspace. This protects their worker threads from wasting CPU on handshakes that will ultimately be rejected. They also use work-stealing queues across hundreds of worker threads to prevent head-of-line blocking when one worker gets stuck on a particularly slow operation.
AWS learned the hard way about certificate rotation. In 2019, a certificate renewal triggered full handshakes across their entire ALB fleet simultaneously because all cached session tickets became invalid at once. Now they stagger key rotation across zones and gradually expire old tickets over hours, not seconds.
What You Can Do Right Now
First, monitor the right metrics. Don’t just track total connection count - track handshake latency at p50, p99, and p999. Track worker thread CPU usage and queue depth. Track session resumption hit rate. These metrics will show problems before users do.
Implement connection pool prewarming in your clients. If you know traffic spikes are coming (deployments, marketing campaigns, batch jobs completing), establish extra connections beforehand. A simple cron job that opens 100 connections and keeps them alive can prevent a thundering herd.
Tune your worker thread count based on CPU cores, not just load. A common mistake is running too many workers, which causes context switching overhead. The sweet spot is usually CPU_COUNT * 2 for CPU-bound crypto work. Use SO_REUSEPORT to distribute incoming connections across workers at the kernel level.
Deploy circuit breakers that detect handshake latency spikes and temporarily reject new connections with explicit 503 responses. This sounds counterintuitive - rejecting connections when you’re overloaded? But it’s better than letting the queue grow unbounded. Clients can retry with backoff, and your existing connections stay healthy.
Finally, if you’re at serious scale, investigate hardware offload with Intel QAT or AWS Nitro. But understand these have fixed queue depths too. You need software-level admission control to prevent hardware queue saturation, otherwise you’ll just move the bottleneck from CPU to hardware queue overflow, which is even harder to debug.
The web dashboard demo below lets you see this in action. Watch what happens to handshake latency when connection churn increases, and how circuit breakers prevent total collapse. It’s one thing to read about queueing theory - it’s another to watch your p99 latency climb from 50ms to 5 seconds in real-time.
Demo Package
This article includes a complete working demonstration that you can run locally. The demo creates a realistic load balancer environment where you can observe TLS handshake latency degradation in real-time.
Git Repository : https://github.com/sysdr/sdir/tree/main/tls_handshake
What’s Included
demo.sh - One-click setup script that creates:
nginx load balancer with TLS configuration (intentionally limited workers to show saturation)
Go backend service tracking connection metrics
Python load generator that simulates traffic patterns
Modern web dashboard with real-time charts and metrics
cleanup.sh - Clean removal of all demo components
Quick Start
bash
chmod +x demo.sh cleanup.sh
./demo.sh
Then open
http://localhost:3000
in your browser to see the dashboard.
What You’ll See
The load generator automatically cycles through three phases. In the first phase, you’ll see healthy metrics with handshake latency around 20-50ms as connections are properly reused. During the second phase, the generator forces new TLS connections rapidly, and you’ll watch the handshake latency climb dramatically - sometimes exceeding 2000ms. The dashboard will shift from green (healthy) to orange (warning) to red (critical) as thresholds are breached. Finally, in the recovery phase, load decreases and latency drops back to normal levels.
This demonstrates exactly what happens in production during events like deployment rollouts that drain connection pools, certificate rotations that invalidate session caches, or sudden traffic spikes that exceed your load balancer’s processing capacity. The visual feedback makes the abstract concept of queueing theory concrete and observable.
Requirements
Docker and Docker Compose installed
2GB free disk space
Ports 3000, 8080, and 8443 available
When you’re done exploring, simply run ./cleanup.sh to remove all components cleanly.